Loyalty


Most ecommerce teams launch a loyalty program at some point. Far fewer ever sit down and do the math behind it.
The loyalty points go live. Customers start earning. And at some point, someone in finance asks: how much is this actually costing us? At that moment, teams discover whether they designed a sustainable customer loyalty program or an expensive guessing game.
I’ve seen both scenarios play out. The difference usually comes down to one decision made early: whether the team defined their point value before launch or after complaints.
Whether you’re asking “how are loyalty points calculated?” for the first time or rebuilding a loyalty program that isn’t working, this guide is the calculation framework I’d use if I were setting up an ecommerce loyalty program from scratch in 2026. It covers the 3-step formula for calculating loyalty point value, four earning models worth considering, real-world numbers from loyalty programs you already know, the accounting side most guides skip entirely, and the common loyalty program mistakes that eat into margins.
Let’s start with a distinction that gets blurred constantly – and costs teams real money when it does.
What Loyalty Points Actually Are (and What They Aren’t)
Loyalty points are the mechanical foundation of brand loyalty – a repeated, preference-driven behavior that underpins customer retention and reduces reliance on acquisition spend.
Understanding the true value of loyalty points – and how to design a point-based loyalty program (or loyalty points program) that earns and redeems them sustainably – is the core skill this guide builds.
Customers earn points by taking actions you’ve defined: making a purchase, writing a review, completing a profile, referring a friend. In exchange, they can later redeem those points for a reward you’ve specified: a discount, a free product, an upgrade.
That’s the mechanics. But there’s a second concept that matters more for your business: loyalty point value. These two things are related but not the same, and confusing them is where most loyalty program design errors start.
Concept | What It Is | Example |
|---|---|---|
Loyalty points | Units the customer earns and holds | 500 points in a member’s account |
Point value | The monetary worth of each loyalty point at redemption | $0.02 per point |
Earning rate | How many loyalty points a customer earns per dollar spent | 1 point per $1 |
Reward percentage | The effective % return on customer spend | 2% (earning rate × point value) |
A customer loyalty program offering 1 point per $1 spent, where 100 points equals $1 off, has a 1% reward rate.
A customer loyalty program offering 10 points per $1 spent, where 1,000 points equals $1 off, has the same 1% reward rate – it just looks more generous to customers because the numbers are bigger.
That optical illusion of large point balances is deliberately used by loyalty programs like Marriott Bonvoy and Airline Miles.
Whether you use 1 point or 100 points as your base unit doesn’t change the economics. What changes the loyalty program economics is the reward percentage – and that’s what the loyalty points formula in Section 3 is designed to help you control.
How Loyalty Points Work: Earn, Redeem, Expire
Before getting into the math, here’s a quick overview of how loyalty points move through a typical customer loyalty program lifecycle.
How Customers Earn Loyalty Points
Earning triggers fall into two categories: transaction-based and behavior-based.
Transaction-based triggers are the most common: earn 1 point for every $1 spent. Some loyalty programs add multipliers for certain categories, channels (mobile app vs. web), or customer tiers.
Behavior-based triggers reward non-purchase actions: writing a product review, referring a friend who completes a purchase, following a brand on social media, completing a profile. These expand customer loyalty program reach and reward engagement outside the checkout flow.
The critical design decision here is which behaviors you want to reward. Rewarding everything dilutes the signal. Rewarding the specific actions that correlate with customer lifetime value (CLV) – first purchase, referral, repeat purchase within 30 days – focuses the loyalty program budget on what actually drives customer retention.
Pro Tip: Weight action-based points to match business value Not all customer actions are worth the same to your business. A referral that converts to a paying customer is worth more than a social media follow. Build your action-based earning rates to reflect that: a converted referral might earn 200 points, a product review 50, and a profile completion 25. This prevents customers from gaming low-effort actions while ignoring the ones that actually move your metrics. |
How Customers Redeem Loyalty Points
Common redemption options in a typical reward catalog include discounts on future orders (either as a flat value or a percentage off), free products, exclusive access to sales or early launches, and gift cards.
This earn and burn cycle – accumulating points, then spending them – is the fundamental loop that defines how a points loyalty program feels to customers.
Beyond the standard discount coupon and free product options, loyalty programs increasingly offer experiential rewards such as early access events, personalized consultations or charity donations, which carry high perceived value at lower direct cost.
Redemption design affects behavior as much as earning design does. If the minimum redemption threshold is set too high – say, requiring 500 points before any reward is available, when the average customer earns 50 points per order – most customers will never actually redeem, which undermines the entire retention purpose of the loyalty program.
Pro Tip: Offer a low-threshold “starter reward” Add a low-cost entry-level redemption option alongside your main rewards – something achievable in 1-2 purchases. For example, 50 points for a free sample or a $1 discount. It gets customers into the redemption habit early and demonstrates the customer loyalty program is real, not theoretical. The psychological effect of a first redemption on loyalty program engagement is disproportionate to its monetary value. |
Why Loyalty Points Expire
Loyalty points expiration serves two purposes: 1) it encourages redemption behavior (creating urgency), and 2) it limits your loyalty program’s financial liability.
Your points expiration policy is one of the most customer-visible loyalty program decisions you’ll make – and one of the most common sources of member frustration when it’s poorly communicated.
Expiration policies range from time-based (points expire 12 months after they were earned) to inactivity-based (points expire after 6 months with no account activity) to no expiration at all.
No expiration might seem like a loyalty signal to customers, but it accumulates liability. A large unredeemed points balance is a deferred cost sitting on your books. Managing it starts with having a points expiration policy – and understanding what that loyalty program liability looks like before it becomes a problem.
The 3-Step Formula for Calculating Loyalty Point Value
This is the core framework for reward points valuation – the process of determining what each point in your loyalty program is actually worth to both the customer and your business.
Most teams either skip this entirely and set a round number (“let’s do 1 point per dollar and make 100 points worth $1”), or copy what a competitor is doing without knowing whether it makes sense for their margin structure.
Neither approach is a calculation. Here’s the one that actually is.
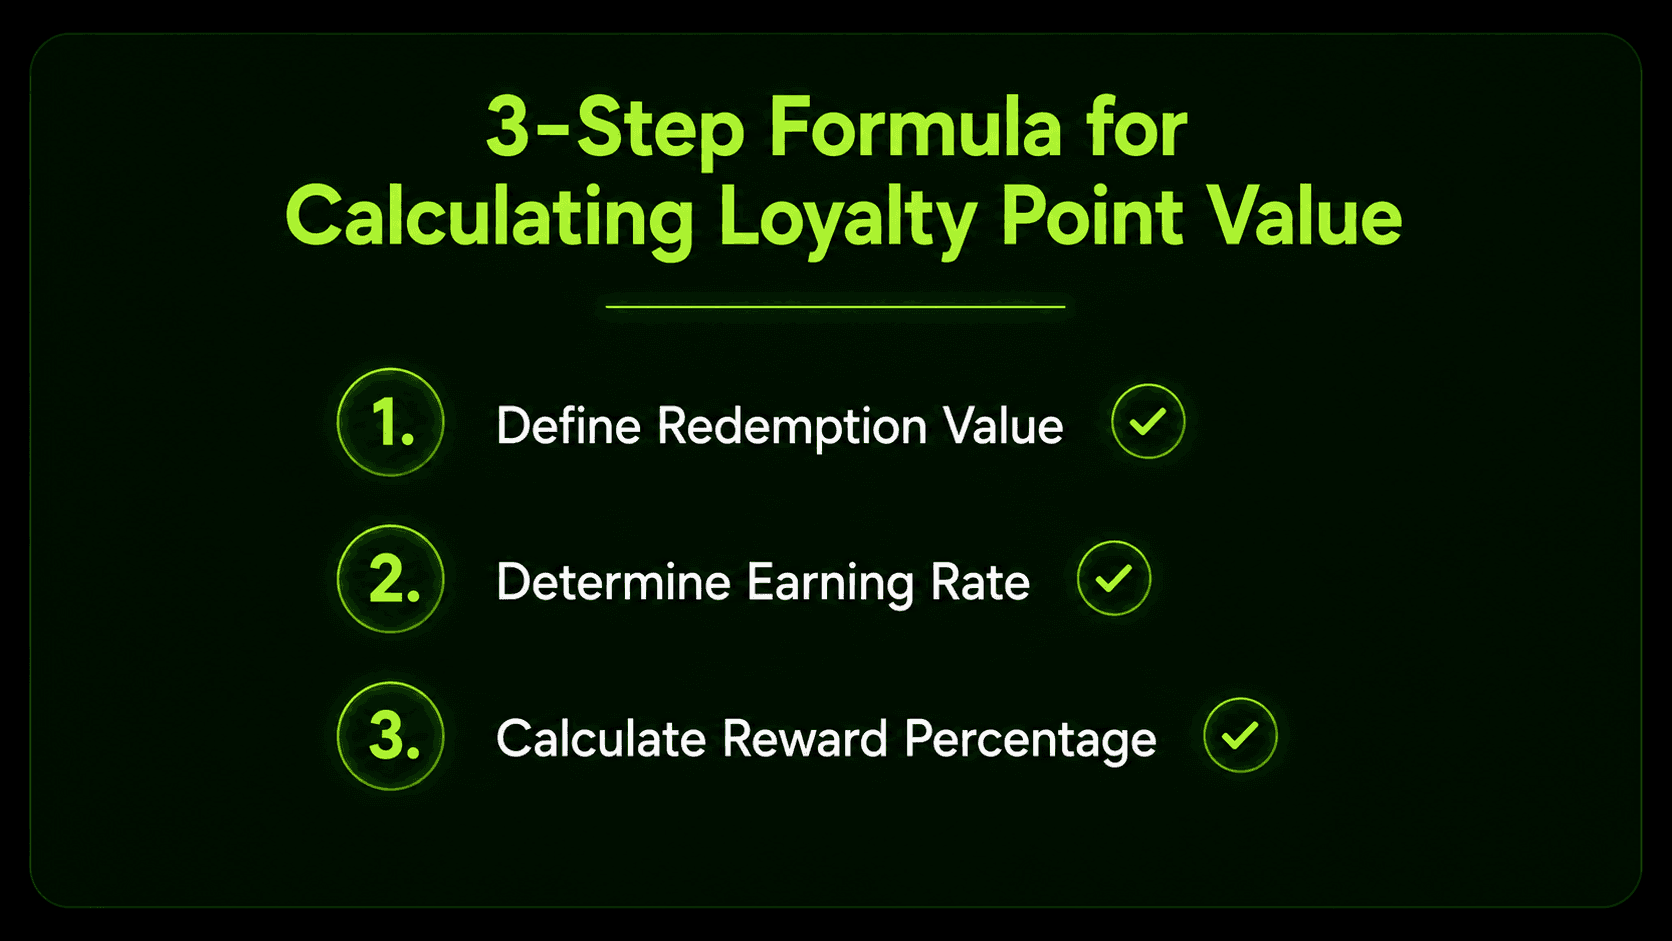
Step 1: Define Redemption Value
Redemption value in a loyalty program is the dollar amount a customer receives when they redeem their points – it’s the foundational figure in any redemption value calculation, and the denominator in your point value formula.
Decide: how much real monetary value does 1 point represent at redemption? This number lives on your side of the white-label loyalty program design – you set it, and it implies a cost.
|
Example: If customers redeem 500 points for a $5 discount, then:
|
That $0.01 is your loyalty point value. Every point you issue to a customer is a $0.01 liability to your business until it either gets redeemed or expires.
Pro Tip: Use a “cents per point” (CPP) or point-to-cash ratio across your whole team Express your loyalty point value in cents per point (CPP) rather than as a ratio. “$0.02 per point” is easier to reason about than “500 points = $10.” When you’re comparing two redemption options, calculating the CPP for each makes the math instant: 500 points for $10 = 2 CPP vs. 2,500 points for $100 = 4 CPP. The second is twice as generous – that distinction matters when you’re modeling loyalty program costs. |
Step 2: Determine Earning Rate
Earning rate (or earning ratio) is simply how many loyalty points a customer accumulates per dollar spent.
But points are just half the story. To calculate the true financial return you are handing back to customers on every transaction, you have to look at your earning rate and redemption rate together.
|
Example: If a customer earns 1 point per $1 spent, and each point is worth $0.01 at redemption:
|
Raise the earning rate to 2 points per $1 without changing the point value, and you have a 2% reward rate. Double the cost, no change in perceived loyalty program structure.
Step 3: Calculate Reward Percentage
The reward percentage is your headline number: what percentage of every dollar a customer spends comes back to them as reward value. It’s the figure you need to calibrate against your margins.
This three-step loyalty points formula – redemption value, earning rate, reward percentage – is the complete calculation.
|
If you’re selling products at a 50% gross margin and your reward rate is 3%, the loyalty program costs you 6% of gross margin (3% direct cost at a 50% margin). The cost of rewards – the actual cash outlay per rewarded transaction – is what determines whether the customer loyalty program is financially sustainable. Whether that cost is justified depends on what you expect to get in return in repeat purchase rate, higher average order value, and reduced customer acquisition cost.
Industry data consistently shows that sustainable retail loyalty programs run reward rates of 1–5%. Below 1% and customers often feel the reward isn’t worth the effort. Above 5% and the loyalty program is likely running at a loss unless it’s generating disproportionate revenue gains. Most well-structured loyalty programs sit in the 1.5–2.5% range.
Pro Tip: Build a margin sanity-check before you publish your reward rate – your ecommerce loyalty program ROI depends on it Take your gross margin percentage and multiply it by your reward rate. If your margin is 45% and your reward rate is 3%, the loyalty cost is 6.7% of gross profit per rewarded transaction. If that number is above 10%, you need either a higher margin category to anchor your loyalty program on, a lower reward rate, or very clear evidence that increased purchase frequency will offset it. Run this calculation before launch, not after your first quarterly review. |
4 Models for Earning Points (and When to Use Each)
The loyalty points formula above works regardless of which earning model you choose. But the model determines what customer behavior you’re rewarding – and getting this right matters more than the specific numbers.
It also determines whether your reward structure is a fixed reward (a defined item or amount regardless of spend) or a percentage reward (a proportion of each transaction returned as value) – a distinction that affects both perceived generosity and actual cost.
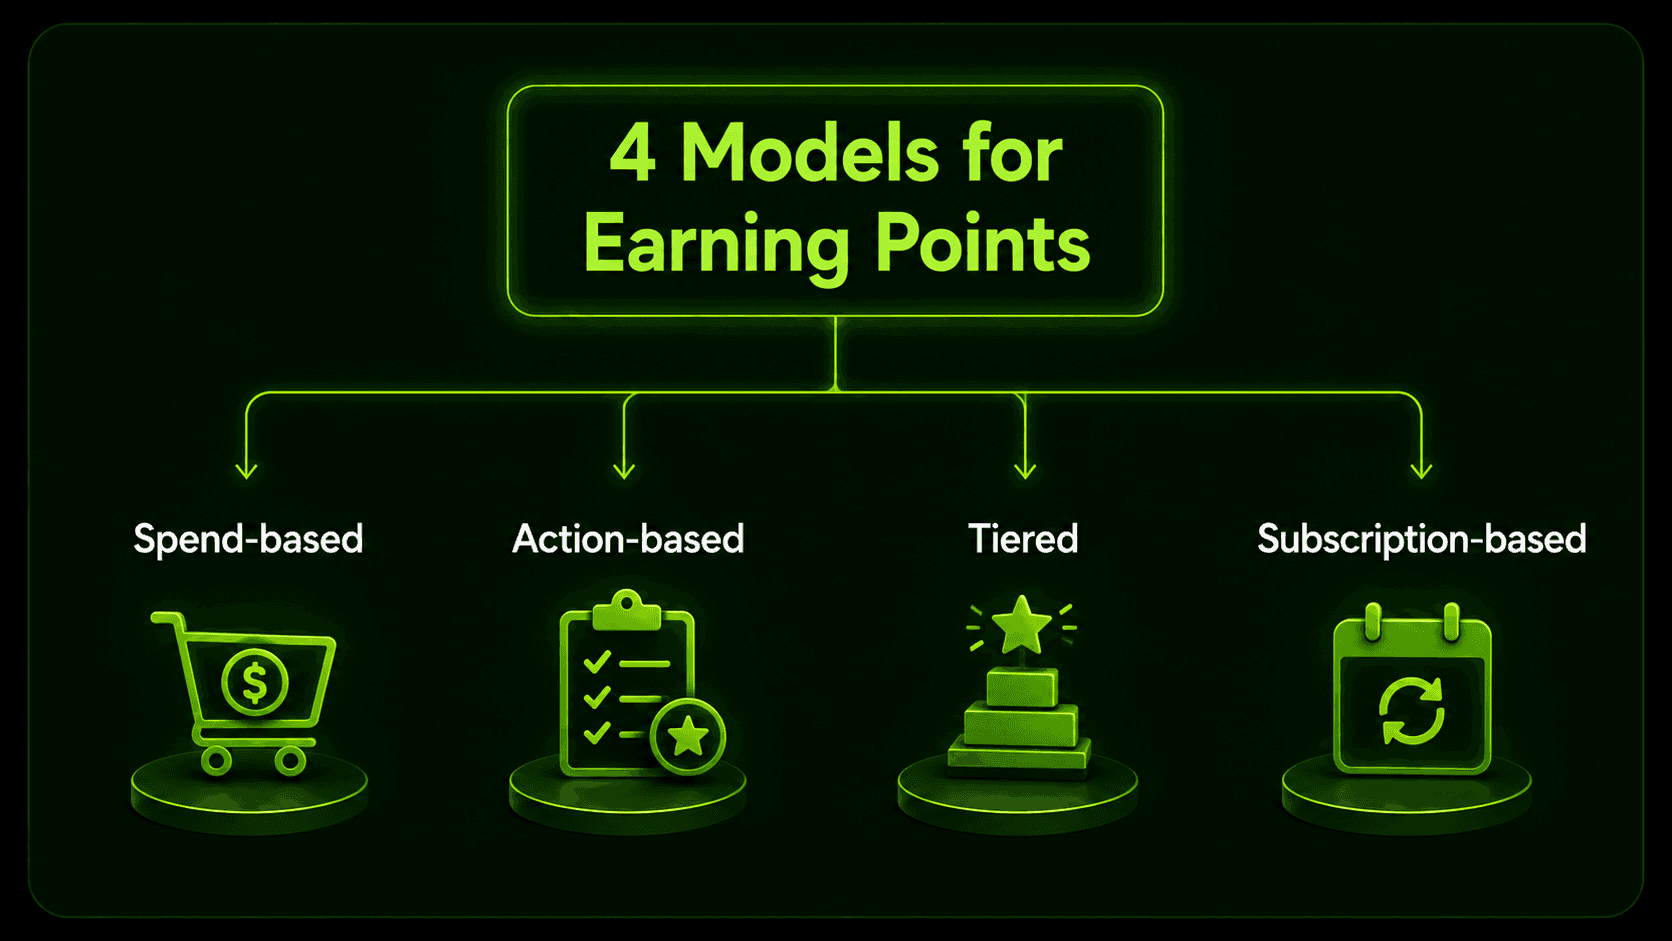
Spend-Based – The Classic
A points-based loyalty program in its simplest form: earn X points per dollar spent. Simple, predictable, widely understood by customers. Best suited for brands with high purchase frequency and relatively uniform order values.
The limitation: it rewards only transactions. A customer who buys once a quarter, spends a lot, and refers three friends earns exactly the same as someone who buys once a quarter and tells no one. Spend-based models alone are a blunt instrument.
Action-Based – Beyond Transactions
Award loyalty points for non-purchase behaviors: a sign-up bonus for new account creation, a birthday reward each year, a referral reward when a referred customer completes a purchase, social media engagement bonuses for follows or shares, product reviews, or profile completion.
Designing loyalty program rewards around these actions – rather than transactions alone – extends the program’s reach and rewards the behaviors that correlate with customer advocacy.
This model works well for brands trying to build a community layer around their product or generate user content at scale. The design challenge is preventing the loyalty program from becoming a gameable system where customers optimize for points rather than meaningful engagement.
Tiered – Different Rates by Status
Customers in higher tiers earn points faster. A base tier might earn 1 point per $1; Silver earns 1.5x; Gold earns 2x. This point multiplier structure is the most widely used form of gamification in loyalty programs: visible progress toward a tier threshold changes purchasing behavior in ways a flat earning rate cannot.
This tiered loyalty program model is the core of Sephora Beauty Insider (Insider / VIB / Rouge), Starbucks Rewards (Green / Gold / Reserve), and most airline programs including American Airlines AAdvantage.
Subscription-Based – Paid Access
Customers pay a fixed monthly or annual fee for enhanced loyalty benefits, including better earning rates. This creates a VIP tier without requiring a spend-based loyalty tier progression – the fee itself is the qualification.
The fee offsets subscription loyalty program costs and self-selects for the highest-intent customers.
REI Co-op is the canonical non-coffee example: members pay a one-time $30 lifetime fee and receive 10% back on eligible purchases annually, a dividend structure that has driven over 24 million active members.
Amazon Prime is the clearest example: a $139 annual fee that funds an ecosystem of benefits and creates a locked-in customer relationship.
At a smaller scale, some DTC brands offer a “VIP membership” that includes 2x points, early access, and free shipping for $9–12 per month.
Model | Best For | Risk |
|---|---|---|
Spend-based | High-frequency retail, subscription products | Rewards transaction volume only; ignores brand advocacy |
Action-based | Community-driven brands, content creators, UGC | Can be gamed; hard to set correct loyalty point values per action |
Tiered | Brands with a wide customer spend range | Complexity; customers may disengage if top tier feels unreachable |
Subscription-based | Brands with strong recurring purchase behavior | Adds friction at enrollment; requires clear value proposition |
Pro Tip: Most loyalty programs that work long-term are a hybrid program A spend-based base (1 point per $1) combined with action-based bonuses (50 points for a review, 200 for a referral) gives you the simplicity of a transactional program with the engagement surface of a behavioral one. The spend base is easy to explain; the bonus actions give engaged customers a way to accelerate their balance. Start with one model, but design the second into your loyalty program architecture from day one so you can activate it without a rebuild. |
4 Real-World Examples: How Famous Brands Calculate Loyalty Points
Abstract loyalty points formulas are clearer when grounded in loyalty programs you already recognize. The customer rewards program examples below – Sephora, Starbucks, Marriott, Nike – each apply the 3-step framework above in a different way, which is why they’re worth studying as a set rather than in isolation.
Sephora Beauty Insider: ~2% Reward Rate
Sephora’s Beauty Insider customer loyalty program operates on a simple base structure: 1 point per $1 spent for all members, with higher tiers (VIB, Rouge) unlocking multiplier events and exclusive redemption options.
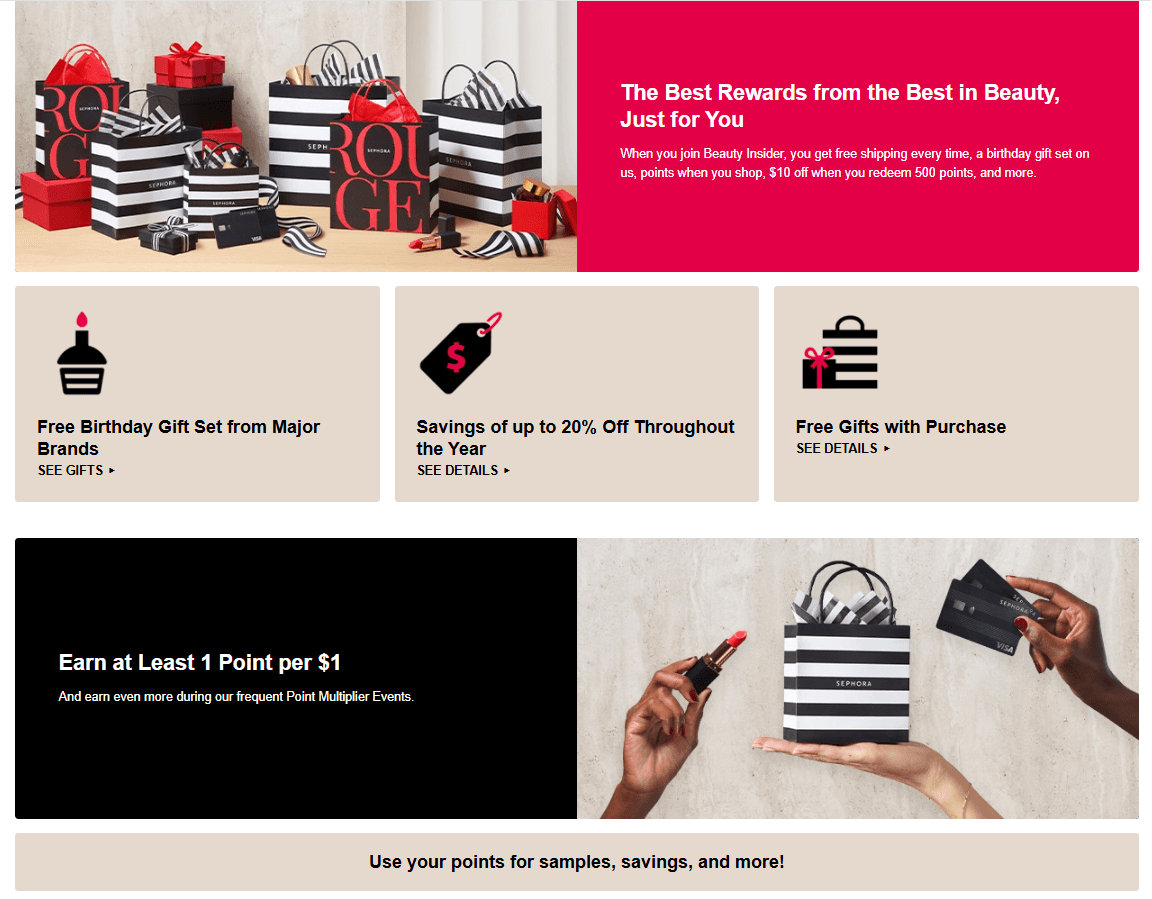
Source: Sephora Beauty Insider loyalty landing page
Earn: 1 point per $1 spent
Redemption (Beauty Insider Cash): 500 points = $10 off a purchase
|
Rouge members can access a better redemption: 2,500 points for a $100 reward, maintaining 4 cents per point. Sephora also runs periodic double and triple-point events, which temporarily increase the effective reward rate without changing the underlying point value.
What to borrow from Sephora’s Beauty Insider: the tiered multiplier structure creates spend motivation without changing the base point math. Their loyalty program stays financially predictable because the redemption value per point is fixed and transparent.
Pro Tip: Double points events and bonus points days cost less than a permanent rate increase Sephora’s double points days and triple-point bonus events generate short-term spending spikes without permanently raising the reward rate. A 3x-points weekend costs the same as raising your base rate by 3x for those days – but it creates urgency and media coverage that a flat rate change never does. Build 2–3 of these into your annual calendar rather than competing on base reward rate alone. |
Starbucks Rewards: Tiered Earning Structure
Starbucks restructured its loyalty program in March 2026 to introduce tiers based on Stars earned per year: Green (base), Gold (500+ Stars/year), and Reserve (2,500+ Stars/year).
Green tier: 1 Star per $1 spent
Gold tier: 1.2 Stars per $1 spent (Stars never expire)
Reserve tier: 1.7 Stars per $1 spent + exclusive perks and events
Redemption structure: 100 Stars for a free coffee or tea (averaging approximately $5–6 in value). At the Green tier base rate:
|
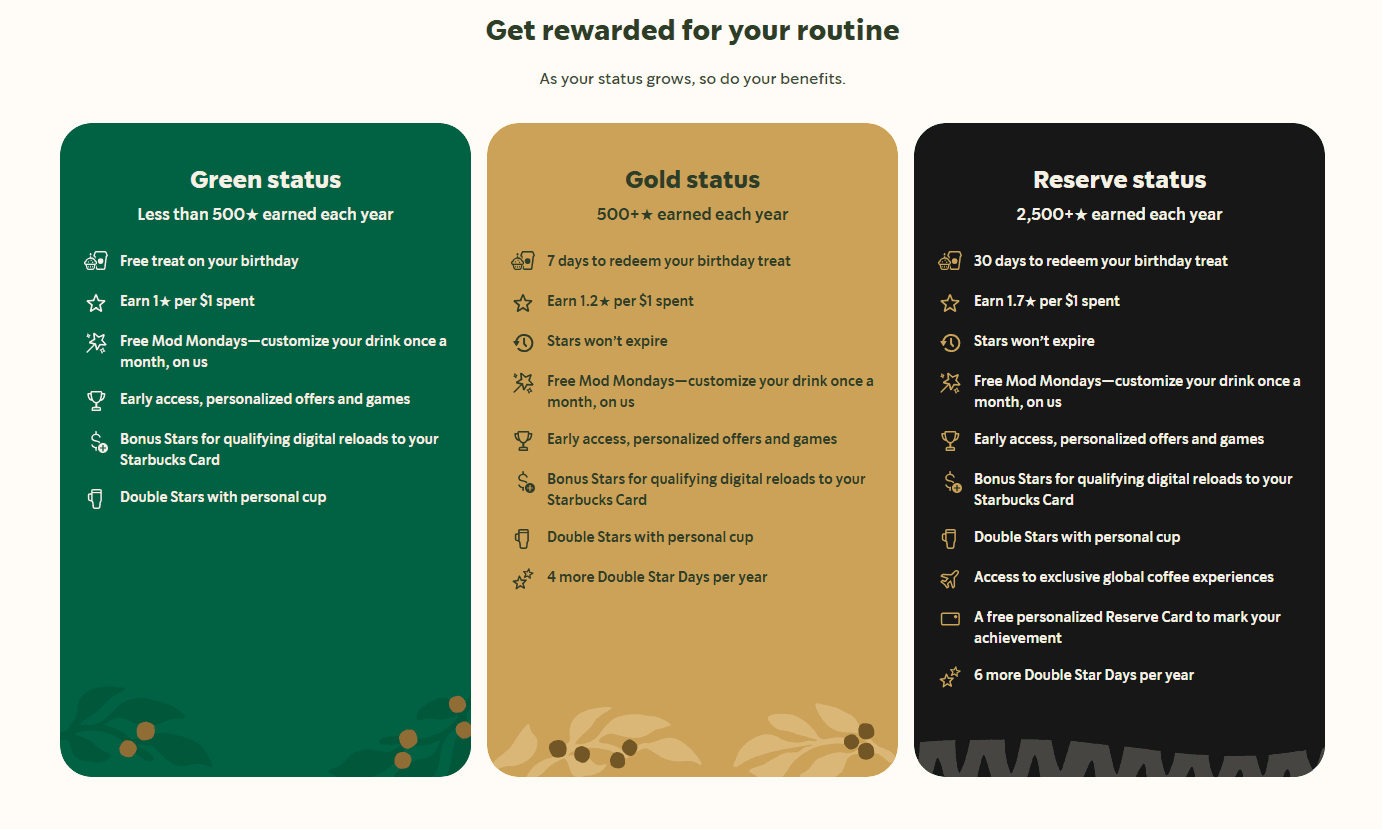
Source: Starbucks Rewards loyalty landing page
The tiered structure gives Starbucks a behavioral tool: customers approaching Gold or Reserve thresholds make incremental visit decisions specifically to reach the tier. The published earnings and threshold data (500 Stars for Gold, 2,500 for Reserve) make this math visible to the customer, which is the behavioral mechanism at work.
Pro Tip: Make tier thresholds visible in the account dashboard Starbucks shows members exactly how many Stars they need to reach the next tier. That visibility is the retention mechanic – a member sitting at 420 Stars, 80 away from Gold, will make different decisions than one who has no idea where they stand. Whatever thresholds you set, display the gap prominently. “You’re 80 points from Silver” converts browsers into buyers in a way that “You have 420 points” never does. |
Marriott Bonvoy: Dynamic Point Value
Marriott Bonvoy loyalty program uses dynamic award pricing, meaning there is no fixed loyalty point value – the number of points required for a free night changes based on demand, date, and property category. This makes the reward percentage harder to define precisely, which is a deliberate design choice.
Earn rate: Base members earn 10 points per $1 spent at most Marriott brands. Elite status adds 10–75% bonus on base earnings.

Source: Marriott Bonvoy loyalty landing page
Point value: According to Yahoo Finance, Marriott Bonvoy points value is at approximately 0.82 cents per point when redeemed for hotel stays. At 10 points per $1 and $0.008 per point:
|
This headline number (8%) looks generous, but the range in actual redemption value is wide. A Ritz-Carlton Maldives booking can yield 1.2 cents per point; a poorly chosen urban hotel might yield 0.4 cents. Marriott’s dynamic model transfers the value optimization to the customer – which works for an engaged customer base but creates loyalty program opacity that can erode trust.
Pro Tip: Dynamic pricing models work best with a clearly communicated “floor value” If you introduce variable redemption values – where points are worth more on some products than others – the loyalty program becomes harder for customers to trust. Marriott manages this by maintaining a minimum redemption value (Instant Rewards at roughly 0.4 cents per point regardless of property). If you use dynamic redemption, always guarantee a floor so customers know their points can never be worth nothing. Without a floor, the perception is that you’re devaluing at will. |
Nike Membership: Non-Monetary Points
Nike’s loyalty program is worth examining precisely because it breaks the conventional loyalty points formula. Nike Membership doesn’t operate on a cash-value redemption model. Instead, points accumulate based on engagement (workouts logged, purchases, app activity) and unlock access rewards: exclusive product drops, early release invitations, personalized training plans, and community events.
This makes the reward percentage calculation irrelevant in the traditional sense, but the behavioral principle is the same. Nike is rewarding specific actions (mobile app engagement, workouts) with things that have high perceived value to their customers (exclusive product access) at relatively low marginal cost to Nike.
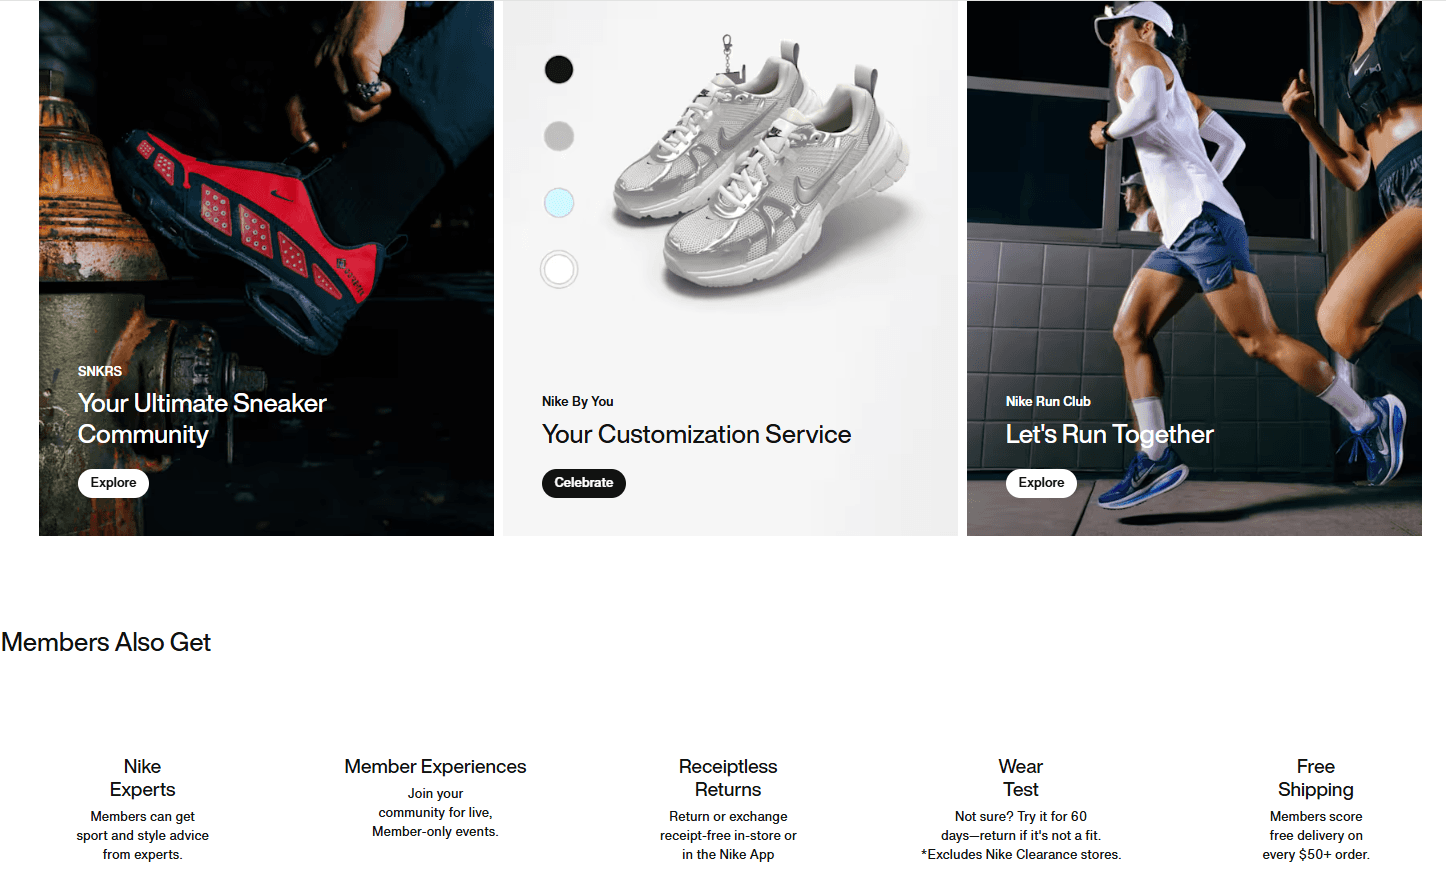
Source: Nike Membership landing page
What to take from Nike: when your reward currency is access rather than cash value, the liability math changes entirely. Customer loyalty programs built on emotional connection – status, identity, exclusivity – can sustain stronger retention than loyalty programs built on cash-back alone – and the retention effect can be just as strong. Over 100 million members spending 3x more than non-members is the outcome of a customer loyalty program that doesn’t run on traditional points economics.
The Accounting Side: Loyalty Points Liability and Breakage
This is the section most loyalty program guides don’t include. It’s also the section that matters most to your CFO.
Loyalty points accounting – how you recognize, defer, and extinguish the financial obligations that points create – is what separates loyalty programs designed to scale from loyalty programs that create balance-sheet surprises.
What is Loyalty Points Liability?
Every loyalty point you issue to a customer is a deferred obligation. The customer has earned the right to redeem that point for a defined value. Until they redeem it or it expires, that outstanding value sits on your balance sheet as a liability.
Under accounting standards (IFRS 15 and ASC 606), loyalty points that represent a material right to the customer must be recognized as a performance obligation. Revenue from the associated transaction is deferred and recognized when the points are redeemed or expire.
For small loyalty programs, this may be immaterial. For customer loyalty programs at scale – or loyalty programs where the aggregate unredeemed balance grows month over month – it becomes a genuine financial management question. The total unredeemed balance is sometimes called the “points float”: cash that has effectively been collected from customers but not yet exchanged for a reward.
What Is Breakage in Loyalty Programs?
Breakage is the percentage of issued points that are never redeemed – because they expire, the account goes dormant, or the customer simply never bothers. Industry breakage rates vary widely, but typical retail loyalty programs see 20–40% of issued points expire unused.
Under revenue recognition standards, expected breakage can be recognized proportionally as revenue over the redemption period, as long as the expectation is based on reasonable historical evidence. This requires tracking your actual redemption patterns over time.
Why Breakage Isn’t Free Money
High breakage looks good on the income statement in the short term. But it’s almost always a symptom of a poorly designed loyalty program, not a feature.
Customer loyalty programs with high breakage typically have redemption thresholds that are set too high for the average customer to reach, point values that are too low to motivate redemption, or poor communication about expiration. Customers in these loyalty programs don’t feel rewarded – they feel like they’re playing a game designed for them to lose. That kills brand trust and undermines the retention purpose of the customer loyalty program.
A sustainable loyalty program design targets a breakage rate of 15–25%: enough to keep the program financially manageable, low enough to indicate that most customers are actually engaging with it.
How Breakage Affects Reward Rate Math
Once you have actual redemption data, you can calculate your effective reward rate – what you’re actually paying out vs. what you theoretically issued:
|
If you issue $200,000 in theoretical point value annually and your breakage rate is 30%, your actual reward cost is $140,000. Plan both numbers. Model both scenarios. The difference between them is cash flow, and understanding it in advance prevents surprises.
Pro Tip: Send expiry notifications 30 and 7 days before points lapse Expiry notifications are your highest-converting re-engagement message. “Your 340 points ($3.40) expire in 7 days” generates immediate sessions from customers who have been dormant for months – and it does it at near-zero cost. Set up automated triggers at 30 days and 7 days before expiry. The lift in redemption activity typically offsets the expiry-related breakage revenue, and the returning customer is worth far more than the points they redeem. |
5 Proven Strategies for Setting Loyalty Point Values That Drive Repeat Purchases
Strategy #1: Align with Your Margin, Not a Competitor’s
The most common mistake we see in the loyalty market is this: a team looks at what Sephora or a direct competitor is offering and copies the reward percentage. The problem is that Sephora’s margin structure, customer lifetime value, and loyalty program economics look nothing like yours.
Start with your own gross margin. If you’re running 40% gross margin, a 2% reward rate costs 5% of gross margin per rewarded transaction. Model what that costs annually at your current volume before you publish the number. Then model what you’d need in incremental revenue from increased purchase frequency to break even on that cost.
These are the loyalty program economics that should anchor every rate decision you make. Measuring loyalty program ROI – incremental revenue from members minus the cost of rewards and platform – is the exercise that confirms whether loyalty program profitability is real or illusory.
Strategy #2: Make First Redemption Achievable in 60–90 Days
The gap between enrollment and first redemption is where most loyalty program participation dies. If a customer joins, earns 30 points on a $30 order, and needs 500 points to get any reward, they have essentially no reason to feel engaged with your loyalty program. The 500-point threshold is invisible to them because it’s at least a year away.
Design your earning rate and minimum redemption threshold so that a typical customer who makes 2–3 purchases reaches their first reward within 60–90 days. That first redemption converts a passive member into a behaviorally engaged one.
Strategy #3: Use Tiered Redemption to Push Higher AOV
Flat redemption structures (“100 points = $1 off on anything”) give customers no reason to exceed a spending threshold to unlock better value. Tiered redemption structures change that: “500 points = $5 off (1% return), 2,000 points = $25 off (1.25% return), 5,000 points = $75 off (1.5% return).”
The higher tiers have better point value, which creates a concrete incentive to accumulate more rather than spend quickly. The mechanism here is switching cost: the more a customer has accumulated, the higher the psychological and financial cost of leaving.
A customer loyalty program that reduces churn rate by raising the perceived cost of switching is more durable than one that merely rewards spend. This is the mechanics behind Sephora’s Rouge Reward (2,500 points for $100 = 4 cents per point vs. 2 cents at the base tier) and the reason Rouge members spend disproportionately more.
Strategy #4: Factor in Breakage in Your Accounting
Not all issued loyalty points get redeemed. The percentage of issued points that expire unused is called a breakage (as it was discussed above), and it directly affects your effective loyalty program cost. If you issue $100,000 worth of points and 25% expire unredeemed, your actual reward cost is $75,000 – not $100,000.
Breakage in loyalty programs is real and worth modeling, but it’s dangerous to build a customer loyalty program that depends on a high breakage to be profitable. Customers who earn points they can’t realistically redeem feel cheated, not rewarded, and the data consistently shows that loyalty programs with low redemption rates have lower retention effects.
Strategy #5: Calibrate Quarterly, Not Annually
Point value settings are not permanent. Your margin structure changes. Your product mix shifts. Your customer acquisition costs evolve. A loyalty point value that made sense at launch may no longer make sense 12 months later.
Build quarterly reviews into your process: track your reward rate against gross margin, monitor redemption rates and average time-to-first-redemption, and be willing to adjust both the earning rate and the redemption threshold.
The loyalty program metrics that matter most – redemption rate, time to first reward, and reward cost as a share of gross margin – should be on a dashboard, not a spreadsheet you open once a year. Many customer loyalty programs that “fail” were actually set up fine but never revisited after launch.
Pro Tip: Track these three numbers every quarter at a minimum Redemption rate: what % of issued points are being redeemed? Below 30% usually means a threshold or communication problem. Average time to first redemption: how long from enrollment to first reward? Above 120 days suggests a threshold that’s too high. Reward cost as % of gross margin: is it moving up? If the margin is compressing while the reward costs stay flat, your reward percentage is effectively rising. |
Loyalty Programs That Worked – and Programs That Didn’t
The loyalty points formula is one thing. Execution is another. Here are some cases of customer loyalty programs that delivered measurable results, and customer loyalty programs that generated measurable backlash – each with a clear reason why.
What Works: Tesco Clubcard (UK) – Data as a Loyalty Asset
Tesco Clubcard, launched in 1995, is the most studied grocery enterprise-level loyalty program in Europe and one of the longest-running retail loyalty programs anywhere. The numbers are significant: 23 million active members across 28.3 million UK households, representing coverage of over 80% of the country. 82% of all Tesco UK transactions are now made by Clubcard members.
Tesco Clubcard demonstrates the commercial power of a mature loyalty ecosystem. According to the IPA effectiveness case study, Tesco added 10.7 million Clubcard members between 2020 and 2023, generating an estimated £627 million in incremental sales and delivering £3.38 in profit return for every £1 invested in the program. Tesco's latest FY 2024/25 results further illustrate the business impact of its customer loyalty strategy, with group sales increasing 4.0% at constant rates to £63.6 billion and adjusted operating profit reaching £3.1 billion.
The mechanism behind the numbers is not a particularly generous reward rate. Clubcard points are worth roughly 1 penny per point at standard redemption, equivalent to about a 1% reward rate on grocery spending.
What made Clubcard structurally different was the use of purchase data: Tesco used Clubcard data to offer members personalized pricing, personalized vouchers, and ‘Clubcard Challenges’ – targeted missions based on each member’s actual shopping patterns. In 2024, Tesco ran Clubcard Challenges campaigns targeting up to 10 million customers, with 76% of page visitors converting to participants and 62% reaching a reward.
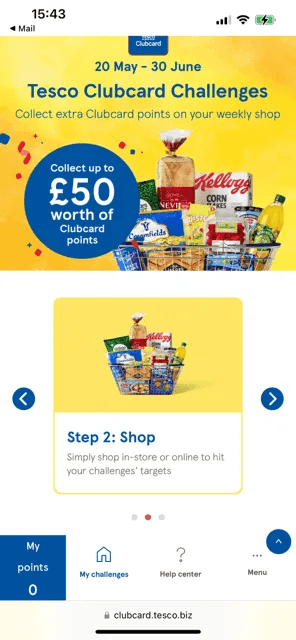
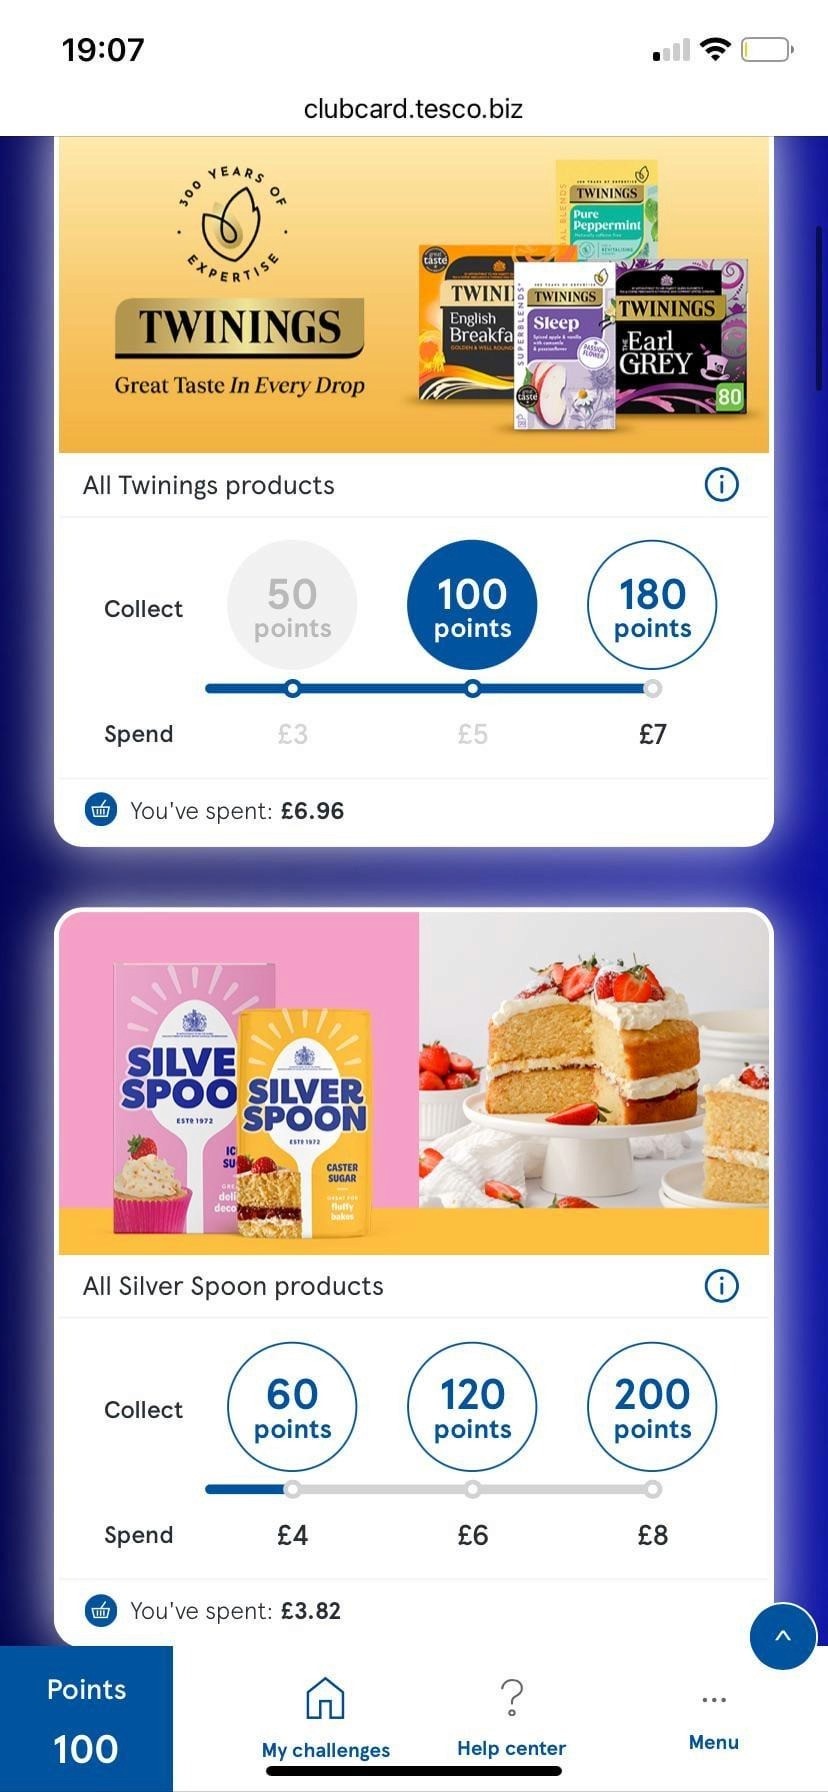
The lesson from Clubcard is not “run a loyalty points program.” It is “use a loyalty points program to generate first-party data that makes every subsequent offer more relevant than the one before.” The loyalty program’s value to Tesco is as much in the customer intelligence it produces as in the direct effect of the rewards themselves.
What Works: Costa Coffee Club (UK) – Simplicity at Scale
Costa Coffee Club was the first points-based loyalty program in the UK coffee industry when it launched in 2010 and now has over 7 million active members in the UK. The loyalty structure is deliberately simple: collect virtual “beans” for every purchase, redeem for free drinks. No tiers, no complex multipliers, no expiry confusion.
Their customer loyalty program’s effectiveness comes from frequency alignment. Coffee is a daily purchase for a large share of Costa’s customer base, which means the earning-to-redemption cycle is short. A customer who buys a coffee every weekday can realistically redeem within weeks, not months.
That fast feedback loop keeps the loyalty program mentally present in the customer’s daily routine in a way that infrequent-purchase loyalty programs struggle to match.
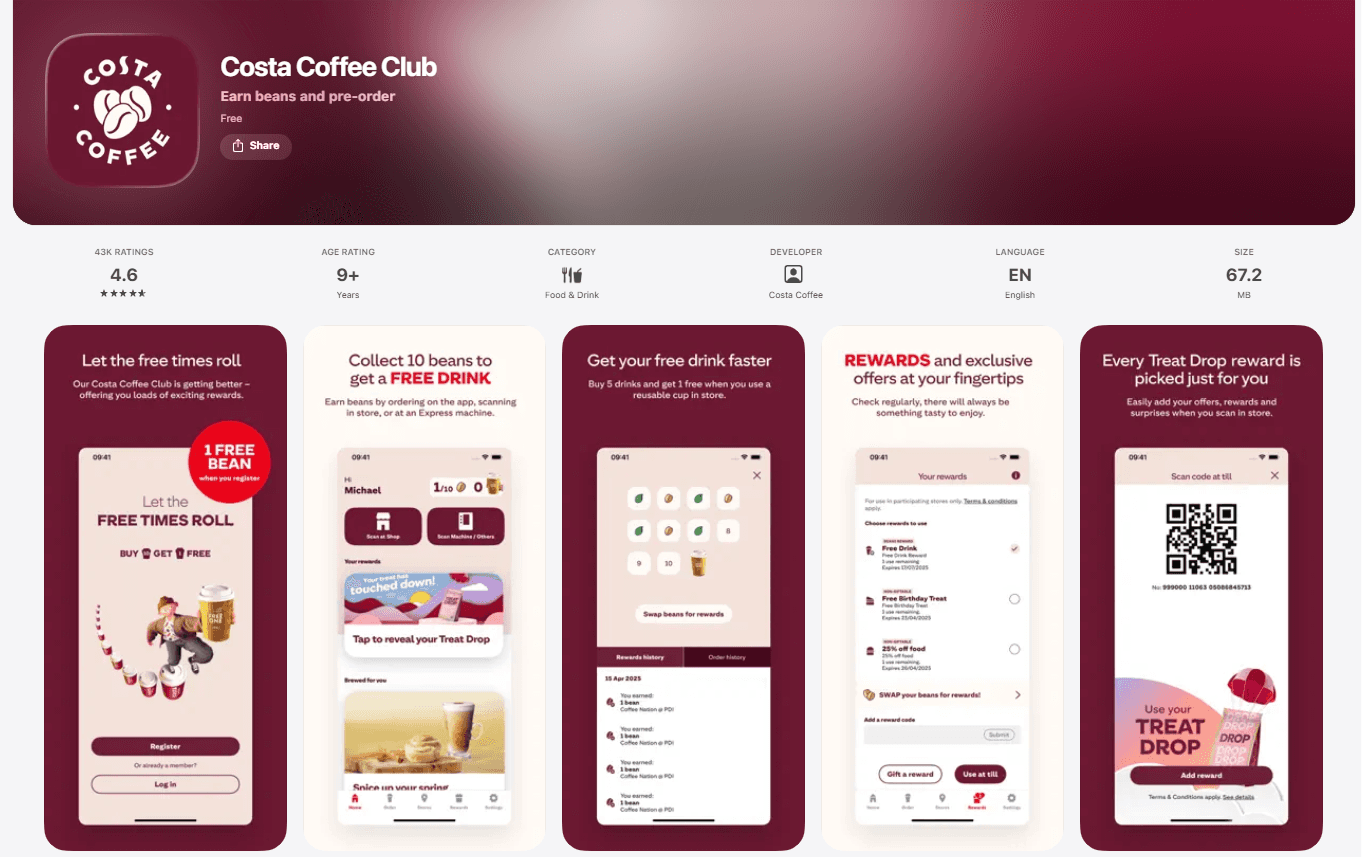
Source: Costa Coffee Club‘s download page at Apple App Store
Costa extended this to its Express vending machines (over 14,500 Alto express machines globally), allowing members to earn across every channel – in-store, drive-through, and machine – on a single account. 82% of loyalty program members demonstrate continued loyalty to the brand.
The structural lesson: for high-frequency categories, a simple loyalty program that delivers a fast first redemption consistently outperforms a complex loyalty program with more impressive headline rewards that are harder to reach.
What Didn’t Work: Dunkin’ DD Perks → Dunkin’ Rewards (US) – Threshold Shock
Dunkin’ Donuts replaced its DD Perks loyalty program with Dunkin’ Rewards in October 2022. The announcement was framed as an upgrade. The customer reaction was immediate and negative enough to generate national press coverage.
The backlash against Dunkin' Rewards illustrates one of the fastest ways to damage customer trust: increasing redemption thresholds faster than perceived value.
Under DD Perks, members earned 5 points per $1 spent and could redeem a free beverage reward for 200 points – equivalent to roughly $40 in spend. When Dunkin' Rewards replaced the old loyalty program, members began earning 10 points per $1 spent, but many popular beverage rewards required 700–900 points. In practical terms, the spend required to earn comparable rewards increased from roughly $40 to $70–$90 for many members.
Dunkin' compounded the frustration in January 2024 by removing several lower-cost redemption options, including espresso shot add-ons that had previously been available for 150 points. While the company positioned the changes as an enhancement to the rewards experience, many customers experienced them as a points devaluation.
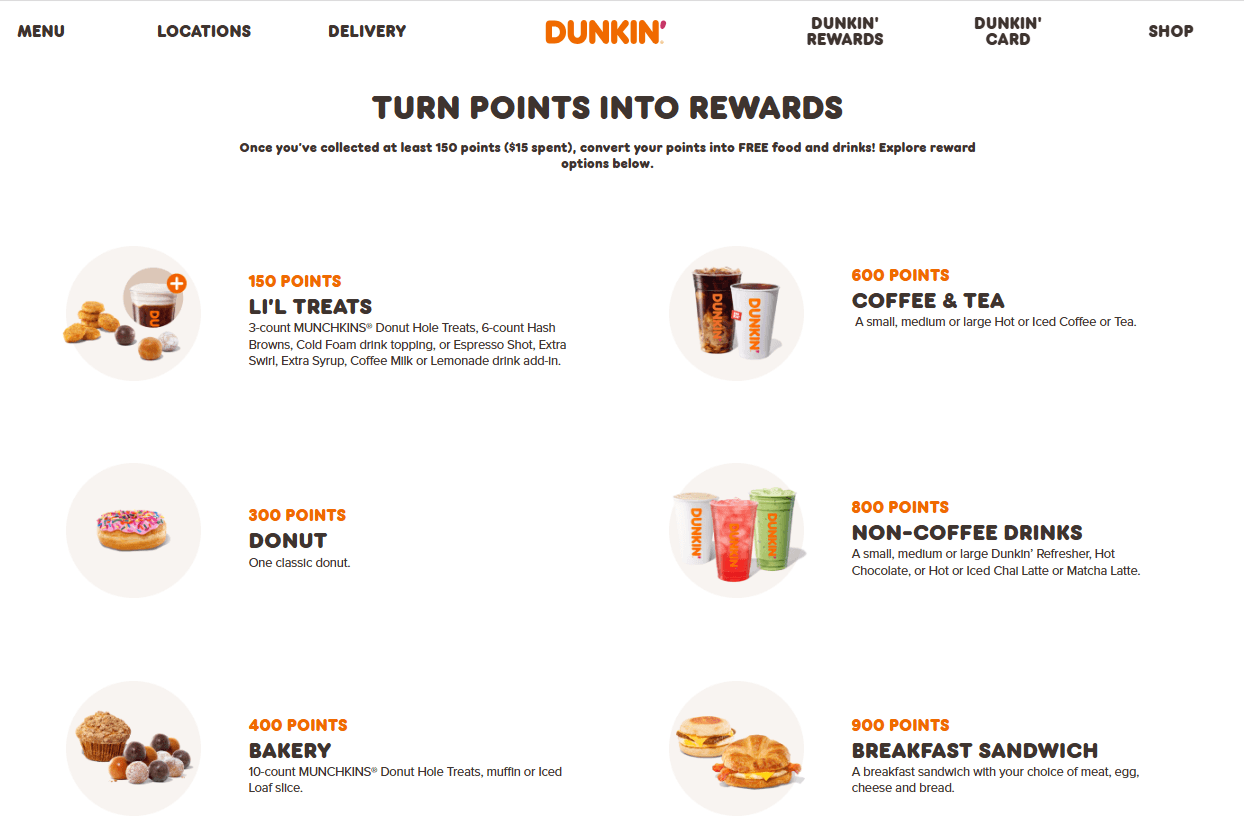
Source: Dunking’ Rewards loyalty program landing page
The lesson for loyalty operators is clear: customers rarely evaluate earning rates in isolation. They evaluate how long it takes to earn something meaningful. When redemption thresholds move beyond what feels achievable, engagement often declines regardless of how many points members earn per transaction.
What Didn’t Work: My Best Buy (US) – Paywalling an Existing Benefit
Best Buy’s My Best Buy rewards program was a free-to-join program that earned points on purchases, accessible to all customers. In two moves – first eliminating its Elite and Elite Plus tiers in May 2022, then in January 2023 restricting point-earning entirely to credit card holders – Best Buy effectively ended the rewards program for the majority of its members.
From February 2023, members without a Best Buy credit card could no longer earn points on purchases. The exchange offered was free shipping on all orders, but this directly replaced a benefit (points toward future discounts) with a logistical convenience – a weaker value proposition for the high-spending loyal customers who had most valued the old multi-tiered loyalty program.
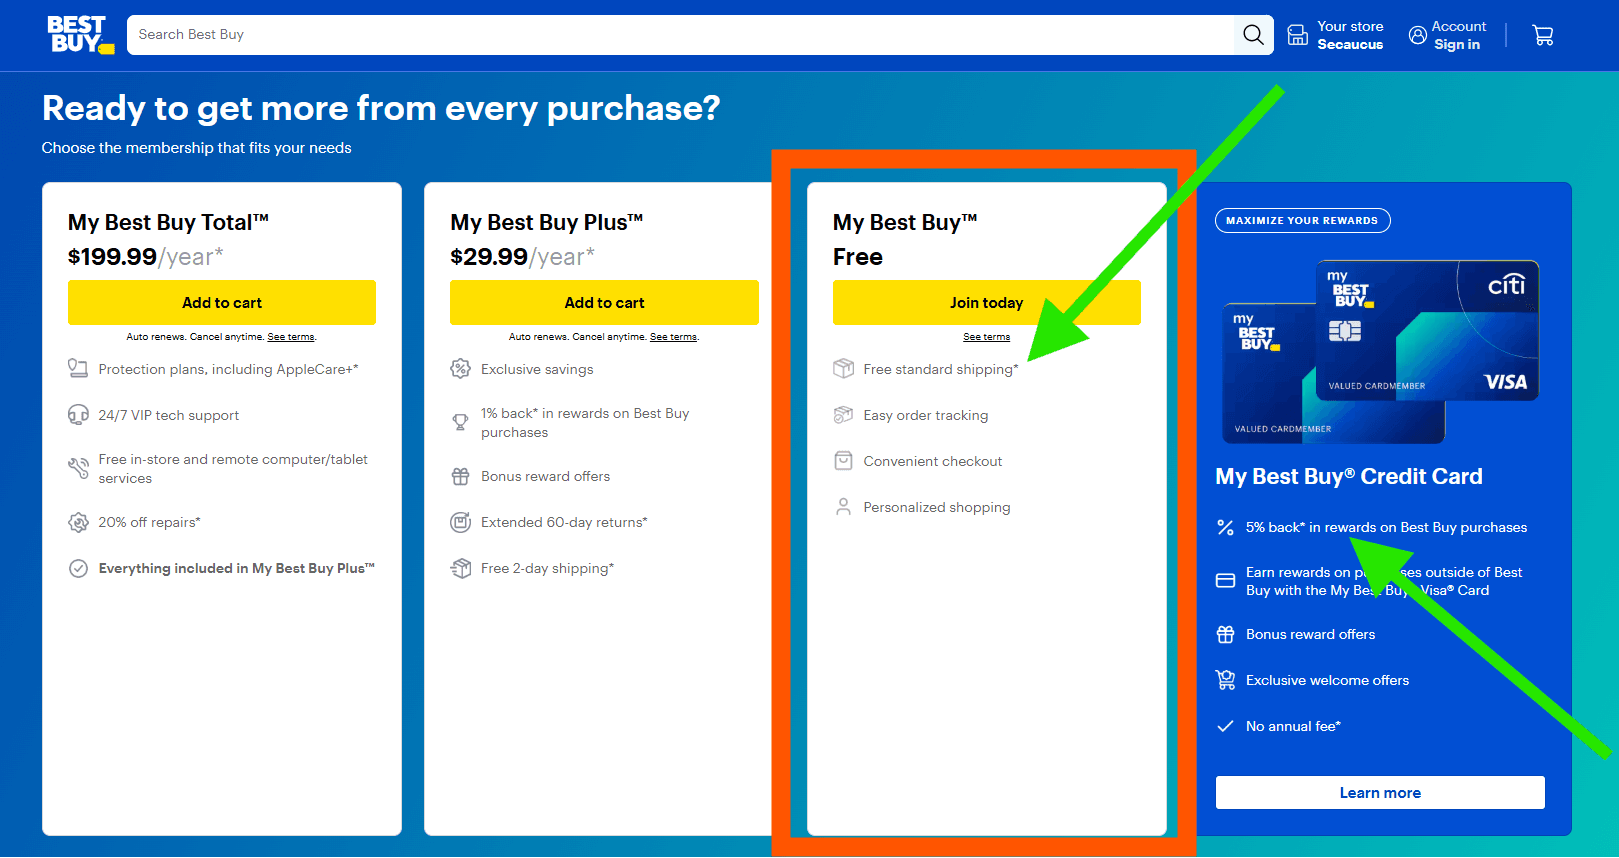
Source: My Best Buy loyalty program landing page
The reaction from long-term members was predictably negative. Analysts described the change as “short-sighted” and noted that the customers most likely to leave were the high-value Elite Plus members who had previously been spending thousands of dollars annually specifically because of the tier benefits.
Best Buy has spent a bunch of time and money on their customer database and, apparently, they think they don’t need the loyalty program to track customers anymore.
The structural lesson is distinct from Dunkin’s: Best Buy didn’t raise the earning threshold – it removed the earning mechanism entirely for non-credit-card holders. Putting an existing benefit behind a new barrier generates more backlash than launching a new loyalty program without that benefit, because it creates a concrete sense of loss. Customers who had been earning 1% back now earned nothing unless they applied for credit. For many, the rational response was to shop elsewhere.
The Pattern Across Failures
Looking across Dunkin’ Rewards, My Best Buy, and the broader hotel/airline devaluation cycle, the common thread is the same: loyalty programs change their economics to reduce costs, but communicate the change as an improvement or ignore the customer’s frame of reference entirely.
A customer who has been earning a free drink for $40 of spend does not evaluate a new loyalty program on its own terms. They evaluate it against what they had.
Any change that reduces the value of their existing behavior – without a clear counter-offer – is experienced as a loss, and loss aversion is a more powerful motivator than reward anticipation.
The customer loyalty programs that avoided this – Sephora, Tesco, Costa, Starbucks – changed their programs too. The difference was that changes were additive (new tiers, new earning options, new redemption paths) rather than subtractive. When Starbucks restructured in March 2026, it added tier-based earning acceleration and new redemption options rather than increasing the threshold for existing popular redemptions.
See our verified templates of ready-to-run loyalty programs for quick launch and proven successful outcome – click here.
How Enable3 Simplifies Loyalty Points Calculation
Designing the math is one part of the problem. The other part is building a system that executes it without requiring an engineering sprint every time you want to adjust a threshold or test a new earning rule. Here’s where a platform decision either accelerates or limits your customer loyalty program’s ability to evolve.
Solution #1: Flexible Earning Rules Without Code
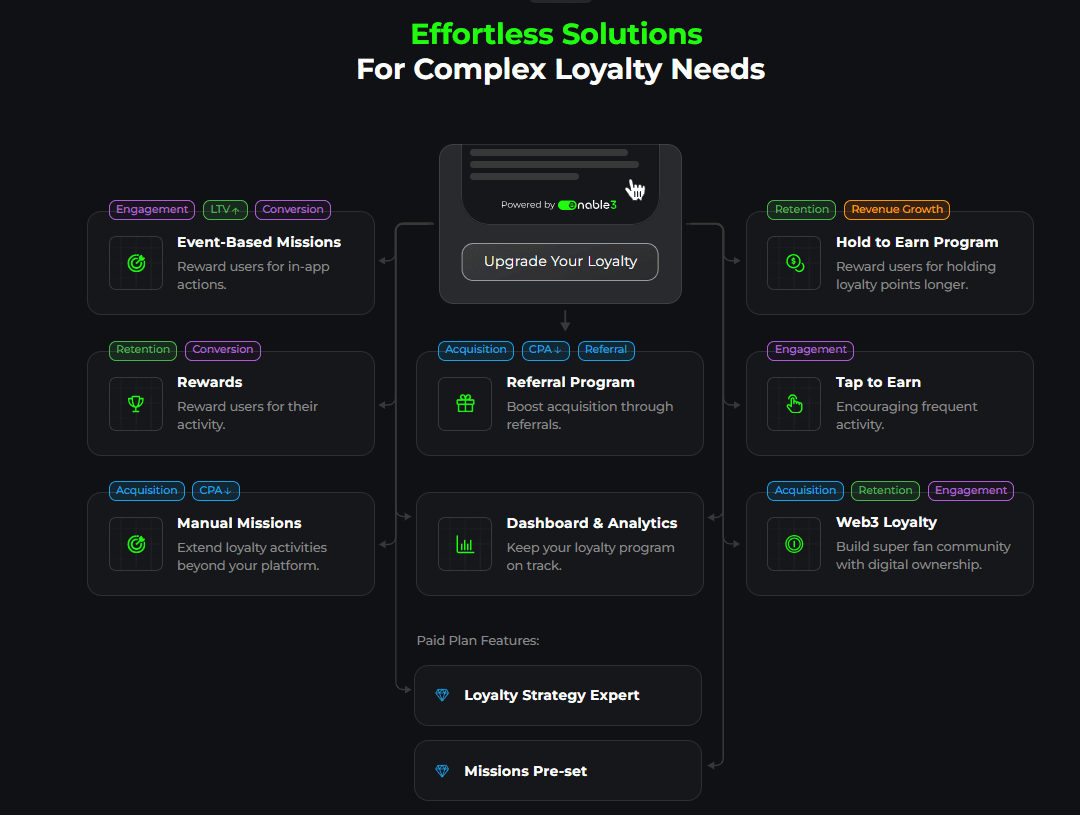
With Enable3’s Missions, you can configure earning triggers for any in-app or in-platform action without a development sprint. Event-based missions award points automatically when a specific behavior is completed: first purchase, referral completion, profile finish, feature activation.
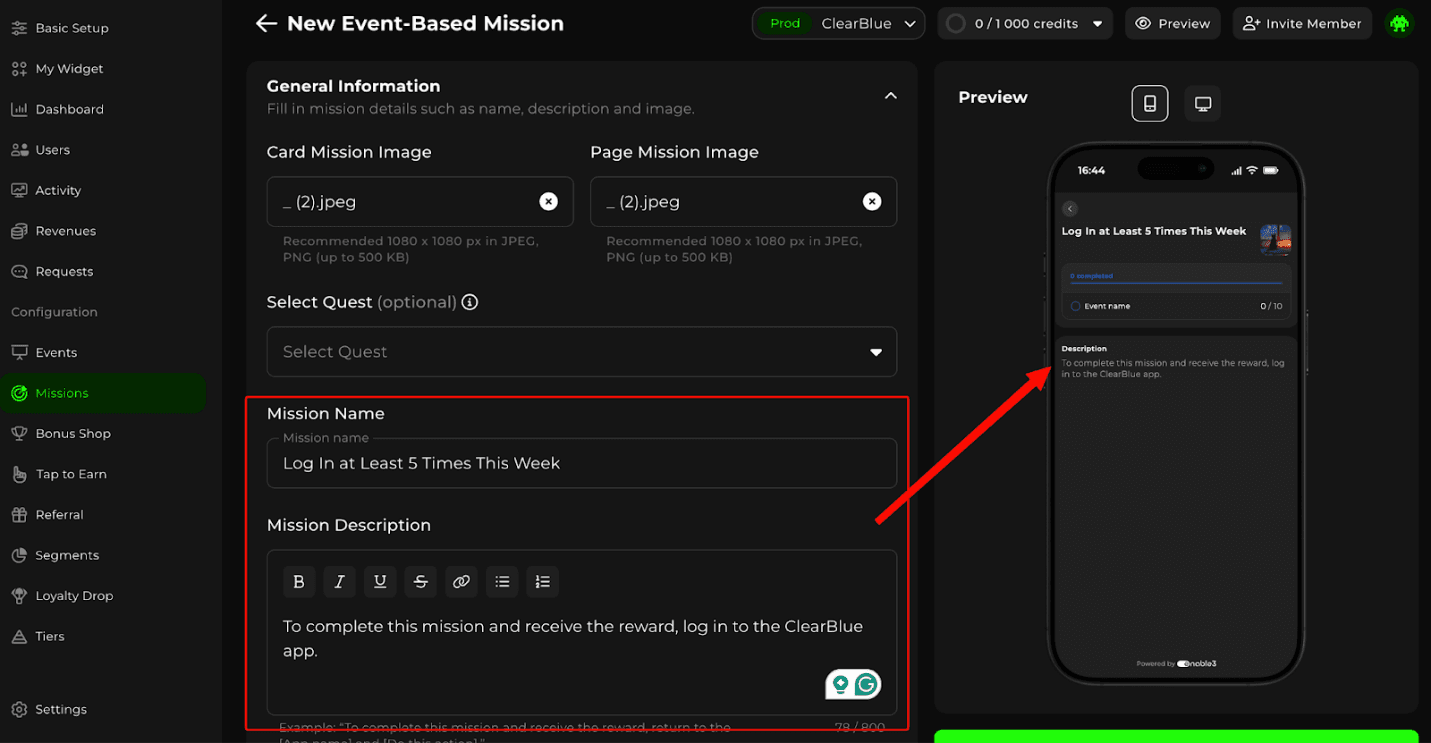
This means your marketing team can adjust earning rates for specific actions – running a double-points campaign for reviews this week, a bonus for app logins during a seasonal window – without submitting a ticket to engineering. The formula doesn’t change. The execution speed does.
Solution #2: Tiered and Dynamic Earning
Enable3’s Tiers allow you to configure different earning rates and rewards at each status level. Bronze members earn the base rate. Silver members earn a multiplier. Gold members unlock exclusive missions and redemption options not available to lower tiers.
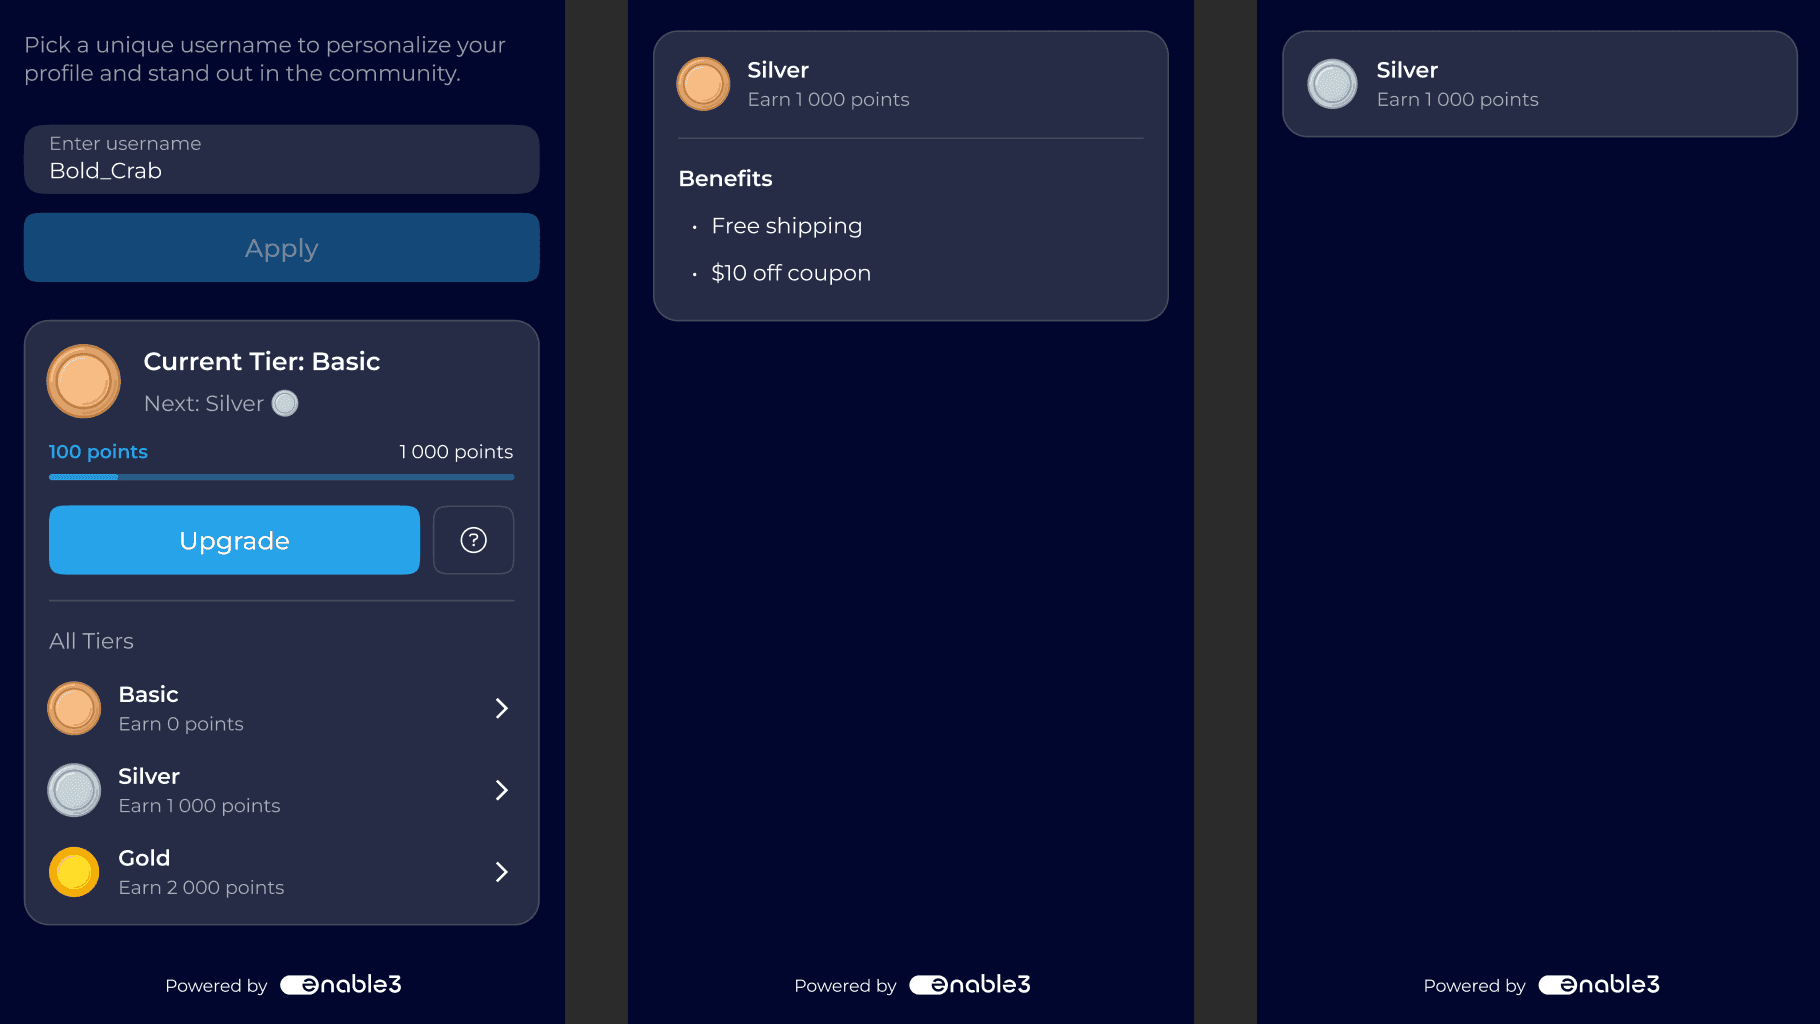
This directly maps to the tiered earning model: you set the conditions, points thresholds, and earning multipliers through the admin panel. Testing whether a tier system improves your D30 retention becomes an experiment you can run in a sprint rather than a quarter-long engineering project.
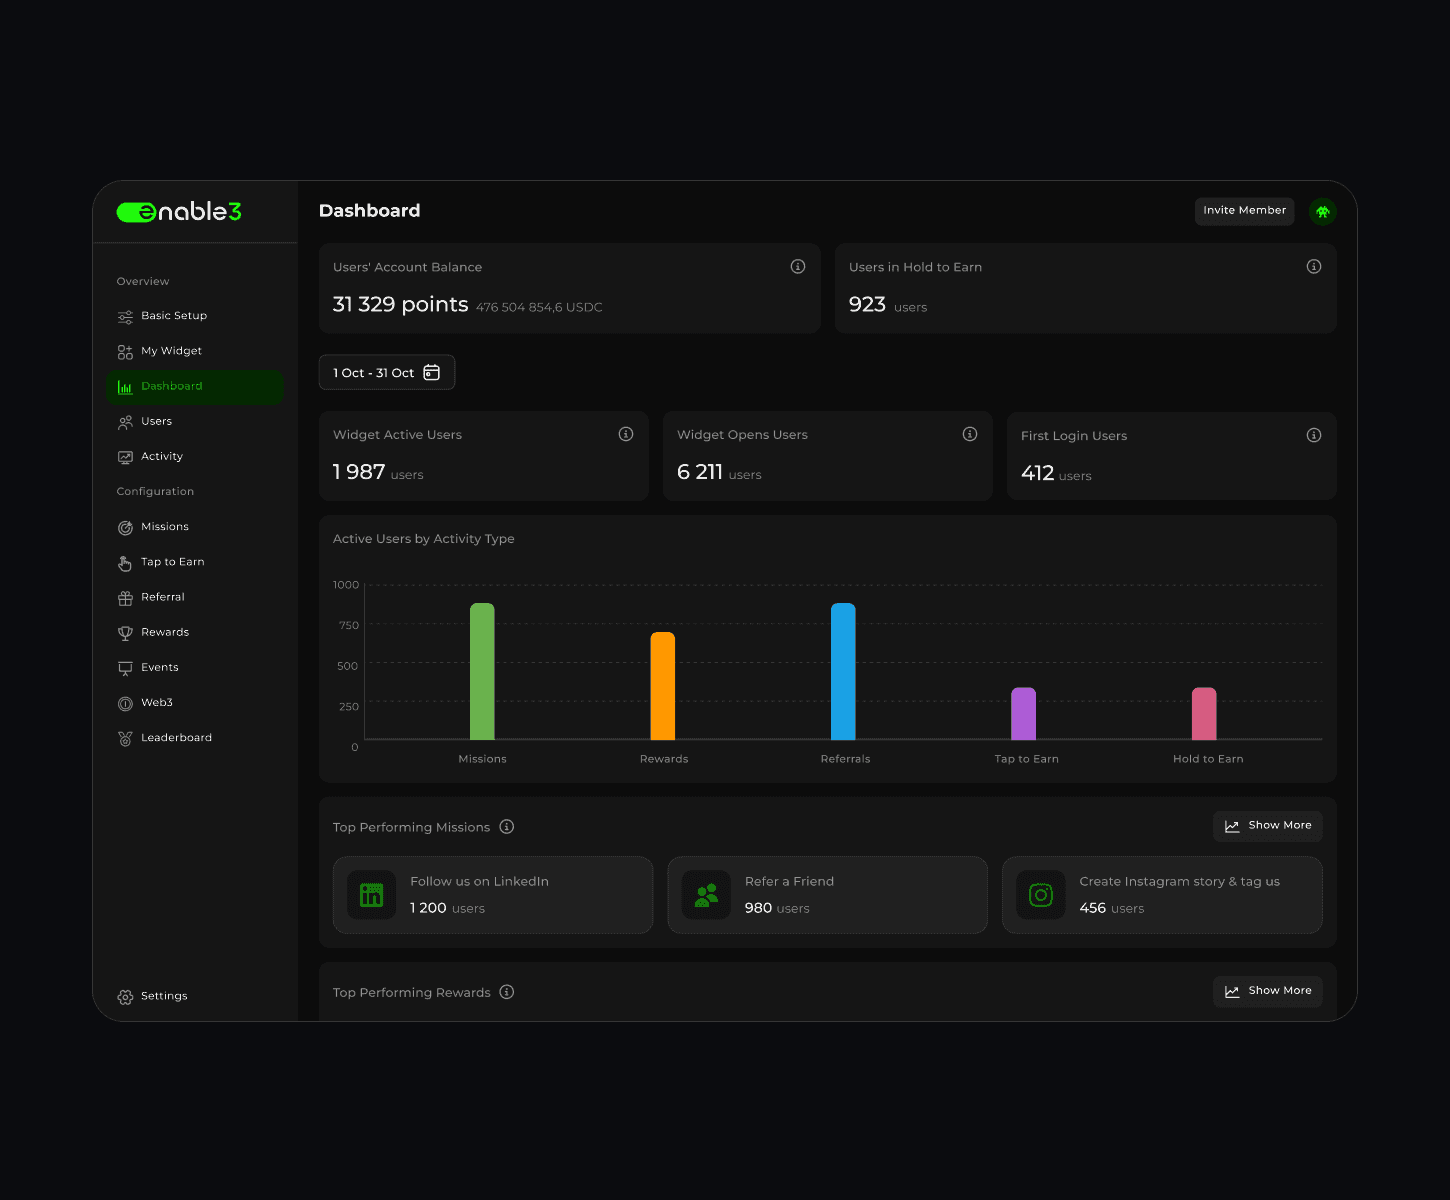
Solution #3: Real-Time Program Analytics
Enable3’s Analytics Dashboard shows mission completion rates, reward redemption patterns, and point activity in real time. You can track which earning triggers are being used, what percentage of your enrolled users are redeeming, and where the drop-off is between point accumulation and first redemption.
That data is what you need to run the quarterly calibration in Strategy #5 above:
Is the effective reward rate aligned with your margin?
Is time-to-first-redemption within your target window?
Which earning actions are driving repeat sessions vs. one-time engagement?
A member vs non-member revenue comparison and a rolling engagement rate metric are the two numbers that tell you, clearly, whether your customer loyalty program is working or not.
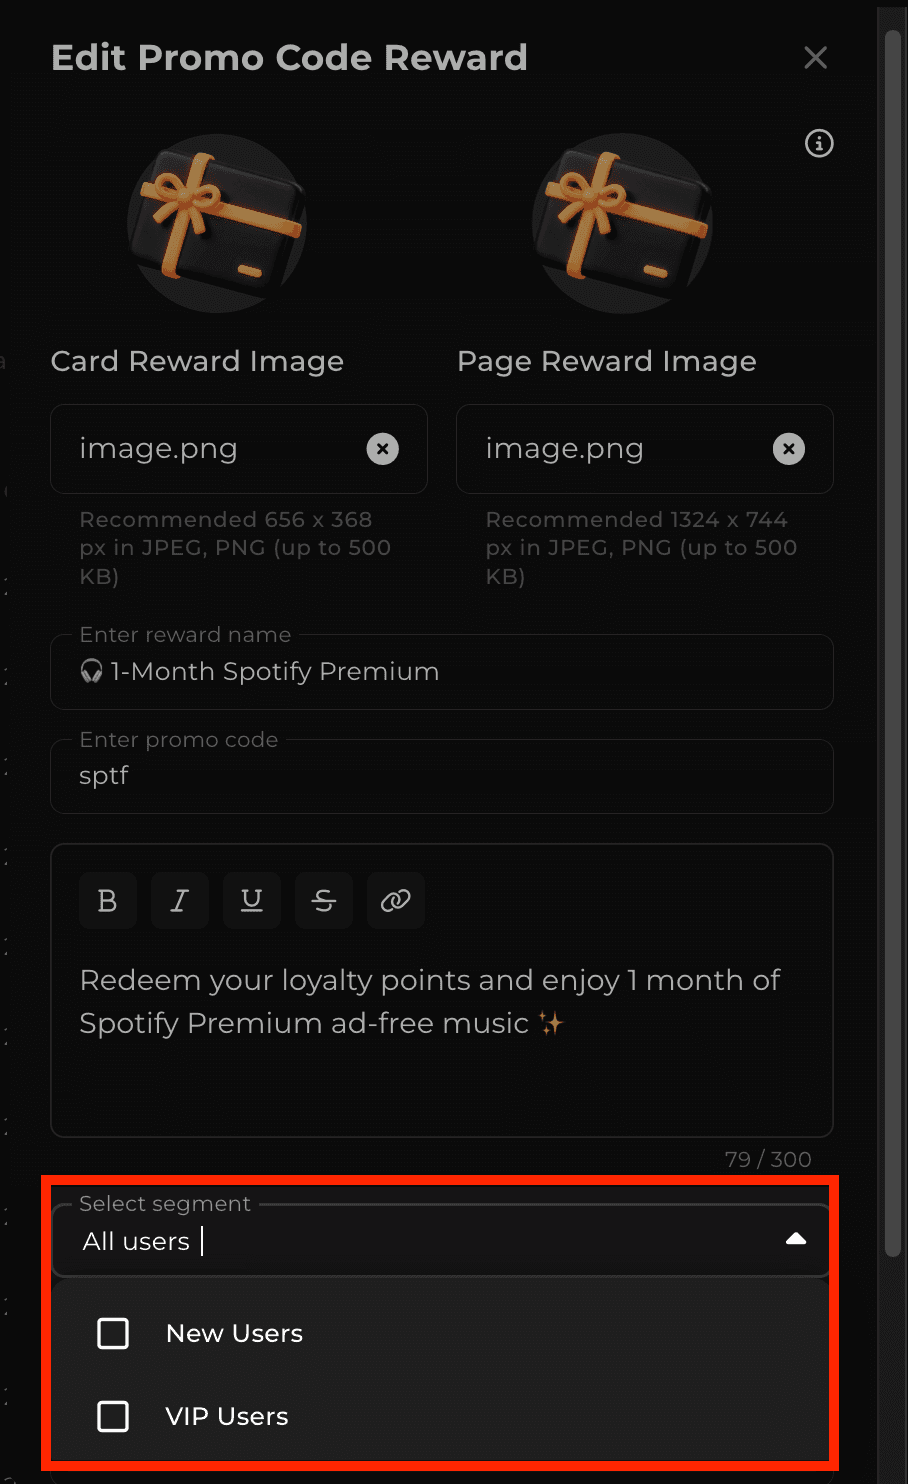
Solution #4: Segmented Campaigns Without Manual Lists
Enable3’s Segments let you group customers by behavioral dimensions – points balance, mission completion history, tier status, last session date – and attach differentiated missions to each group.
New customers in their first 30 days get an onboarding mission with accelerated earning. Customers approaching a tier threshold get a “200 more points to reach Gold” nudge. Dormant members with an expiring balance get a re-engagement mission before the points disappear.
Solution #5: Quarterly Recalibration Without Re-Engineering
Loyalty programs built on hard-coded point logic in a custom codebase require engineering work every time a parameter changes.
Enable3 is designed for marketing-side reconfiguration: earning rates, redemption thresholds, tier conditions, and expiry settings can all be adjusted through the admin panel by the team running the loyalty program.
The quarterly calibration that most customer loyalty programs skip because it’s operationally painful becomes a scheduled review, not a development sprint.
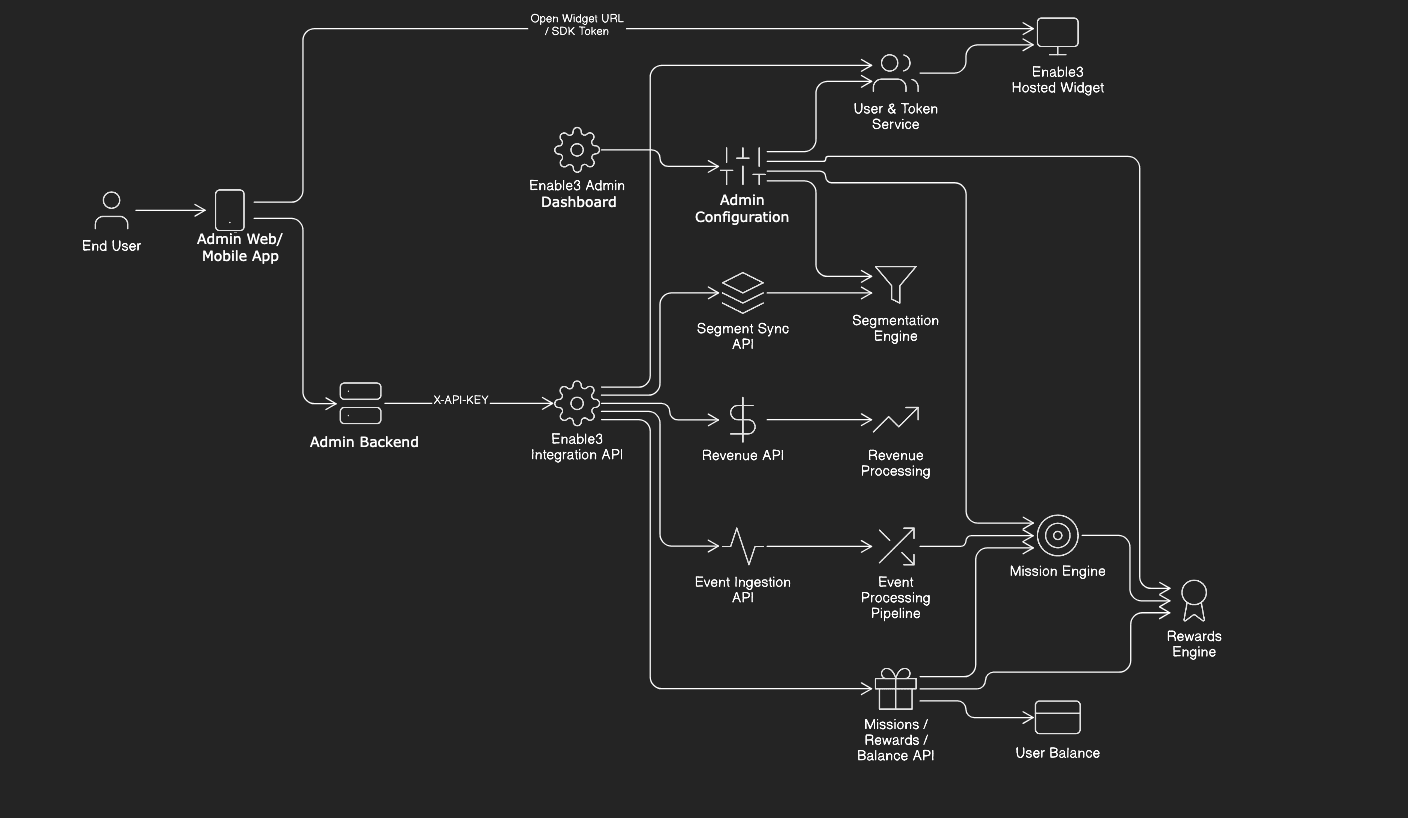
Businesses of all sizes can benefit from our loyalty solutions, thanks to Enable3's flexible integration options – low-code, no-code, and API – whether you’re starting from scratch or enhancing an existing loyalty strategy.
Ready to build a loyalty program around these mechanics?
Enable3 lets you configure earning rules, tier structures, redemption thresholds, and segmented campaigns without engineering work – so the rewards program you design on paper is the customer loyalty program you can actually run and iterate on.
If you want to build the calculation framework above into a working loyalty program, talk to our team or book a demo – and out highly skilled experts will help you map your margin structure to a loyalty program design that works.
Frequently Asked Questions
What’s a good reward rate for an ecommerce loyalty program?
The sustainable reward rate ecommerce teams should target is 1–5%, with most well-structured loyalty programs landing at 1.5–2.5%. Below 1% and the loyalty program rarely generates meaningful customer engagement. Above 5% and the loyalty program typically runs at a loss unless it’s generating disproportionate increases in purchase frequency and average order value that justify the cost. Your specific number should be calculated from your gross margin and modeled against realistic redemption rates, not chosen from competitive benchmarking.
How do I handle loyalty points for returned items?
The standard practice is to deduct loyalty points at the time of the return: if a customer earned 50 points on a $50 purchase that they later returned, those 50 points are deducted from their balance. For partial returns, points are deducted proportionally. This needs to be defined clearly in your loyalty program terms and communicated at enrollment. Customer loyalty programs that don’t have a clear return policy for points create support overhead and customer friction when returns happen.
Should my loyalty points expire?
For most loyalty programs, yes – but the expiry policy design matters more than the binary decision. An inactivity-based expiry (points expire after 12 months with no account activity) is generally better received than a fixed calendar expiry, because it gives engaged customers no reason to worry while creating urgency for lapsed ones. Whatever policy you set, communicate it clearly at enrollment and remind customers via triggered notifications before their balance expires. Surprise expiration is one of the most common drivers of loyalty program abandonment.
What’s breakage and is it bad?
Breakage is the percentage of issued points that are never redeemed, typically because they expire, the account goes dormant, or the customer disengages. A moderate breakage rate (15–25%) is financially healthy and operationally expected. High breakage (above 40%) is almost always a loyalty program design problem: redemption thresholds are too high, point value is too low, or the loyalty program isn’t meaningfully communicated to customers. High breakage rewards programs generate lower retention effects and higher customer dissatisfaction than programs with active redemption. Don’t optimize for breakage. Optimize for redemption, and let breakage be a secondary outcome.
How do I communicate loyalty point value to customers?
Display the dollar equivalent of a customer’s points balance alongside the point total wherever the balance is shown: account dashboard, post-purchase confirmation, email receipts. “You have 420 points – that’s $4.20 toward your next order” is dramatically more motivating than simple “You have 420 points.” Include a clear explanation of how points are earned and redeemed in your loyalty program terms, onboarding email, and FAQ. The customer loyalty programs that drive the highest engagement are the ones where customers always know what they have and what it’s worth.
Can I change my loyalty point value after launch?
You can, but with constraints. Reducing the point value (i.e., making each existing point worth less) is a loyalty program devaluation. Airlines and hotel loyalty programs do this periodically and routinely face significant customer backlash. The practical approach is to grandfather existing balances at the old rate while applying the new value to points earned after the change date, and to communicate the change with significant advance notice. Alternatively, adjusting the earning rate (fewer points issued) while keeping the point value constant achieves a similar financial outcome with less customer perception of being shortchanged.