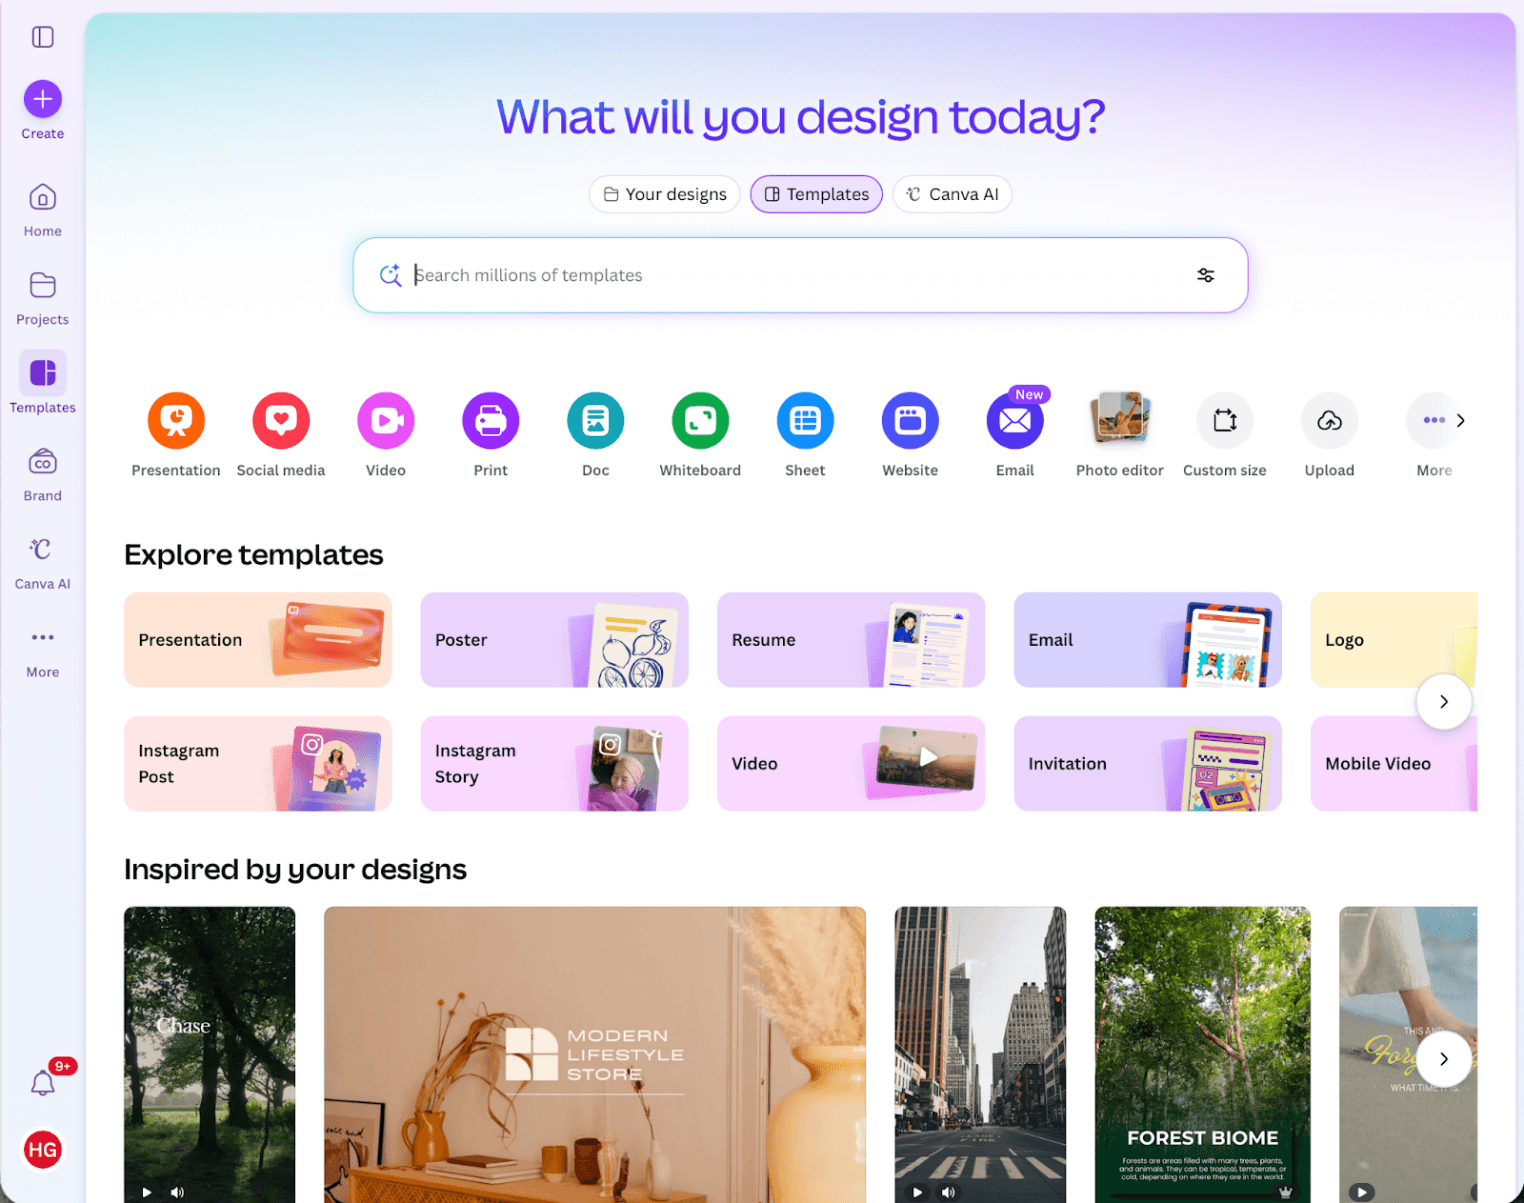
Loyalty


Most app teams confuse marketing with growth. I see this pattern repeatedly – and it is one of the most expensive mistakes a team can make. Because marketing and growth are not the same thing.
Marketing gets users through the door – it is the work of channels, campaigns, and creative that fills the top of the funnel. Growth is what happens after. It is the discipline of turning installs into active users, active users into paying customers, and paying customers into advocates who bring others.
Marketing is a cost center that scales linearly. Growth, done well, is a compounding engine.
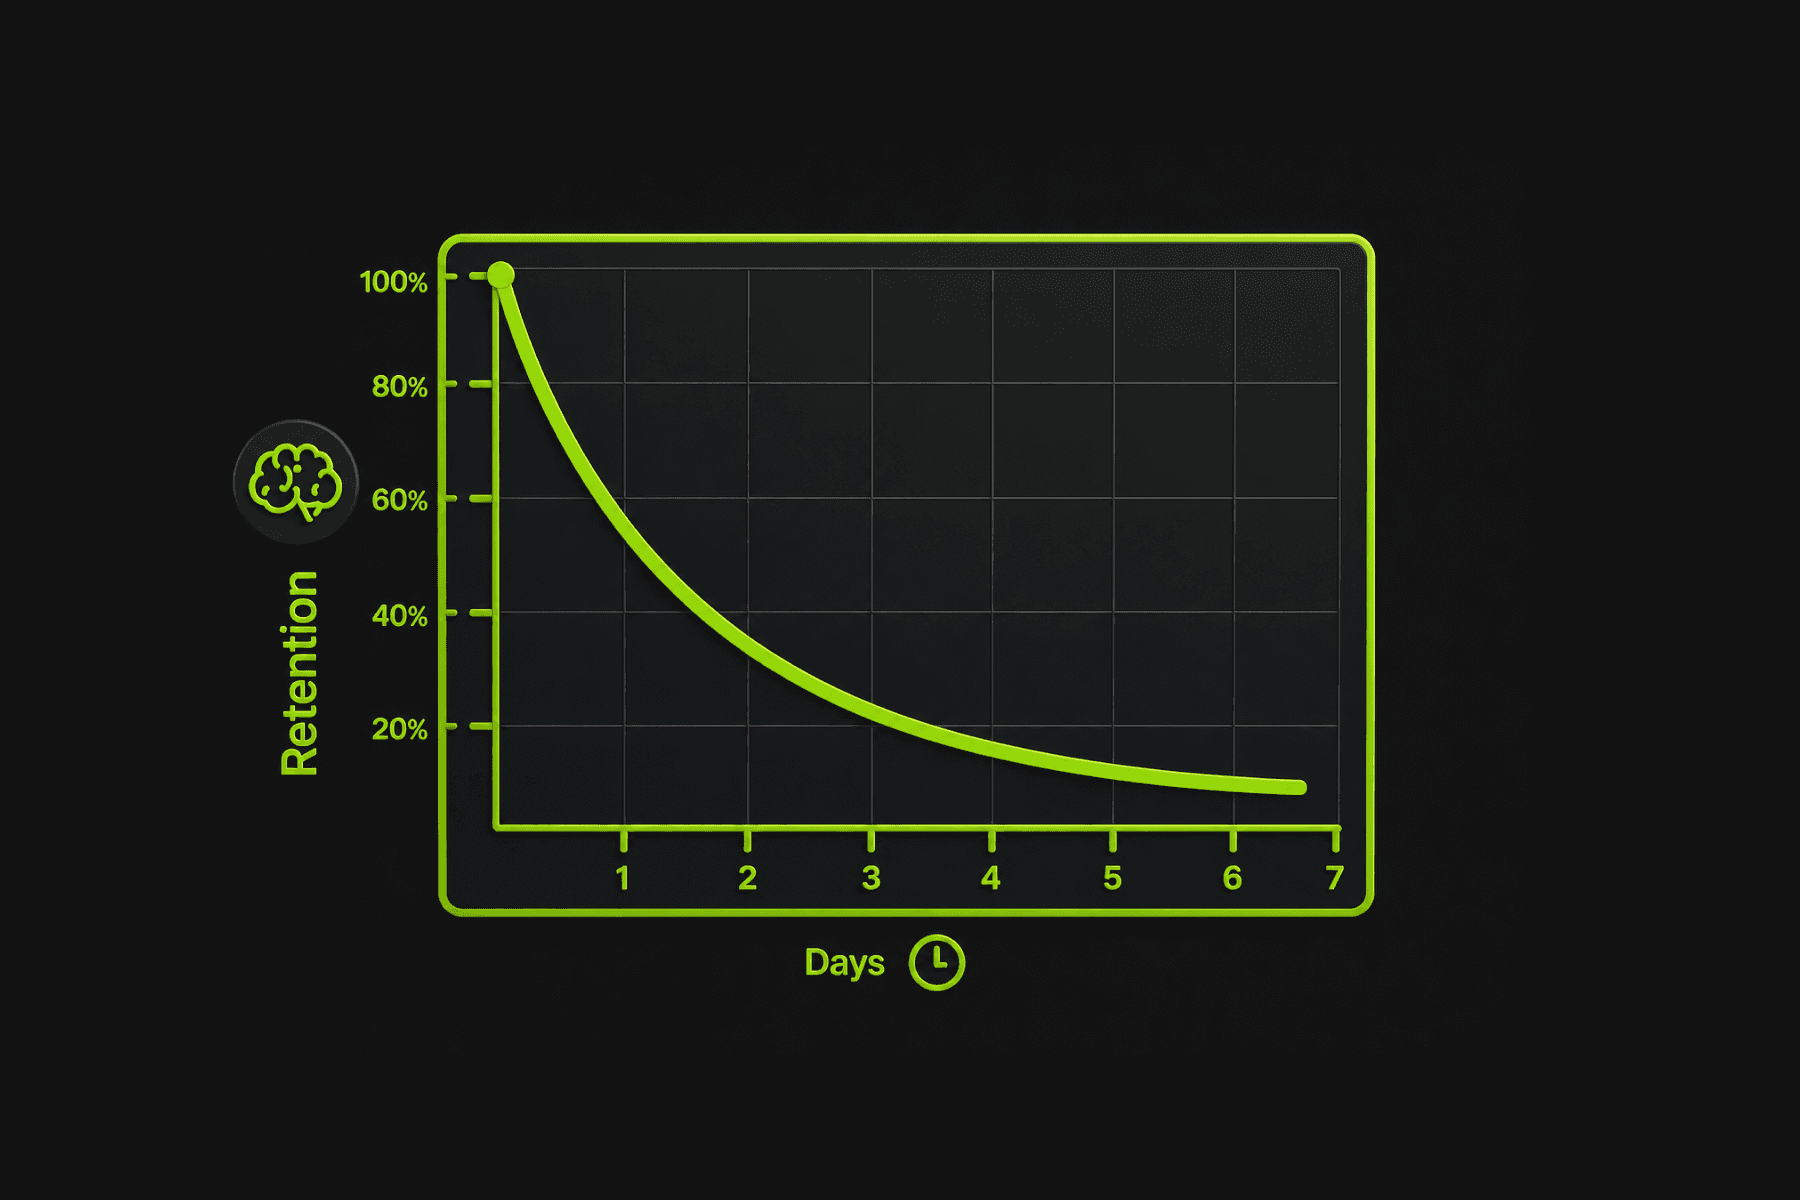
I keep coming back to a simple observation: the apps with the best acquisition budgets are rarely the apps with the best app user retention curves. And retention curves are what determine whether a business survives long enough to reach profitability.
The data supports this. According to Bain&Company, acquiring a new customer costs 5 to 7 times more than retaining an existing one. In the mobile app world, where the average cost per install (CPI) across categories reached approximately $2.24 globally, pouring acquisition spend into a product that churns 77% of users within three days is not a strategy – it is a budget leak with a marketing team attached.
The apps that beat this math – Uber, Noom, Cash App, Pinterest – share a common trait: they treat growth as a system of interconnected loops, not a collection of independent app growth tactics. They run continuous experiments. They measure what matters. And they reinvest the output of one growth cycle into the input of the next.
That is the system I want to help you build here. Not a list of tips. A proven framework for generating not only leads but real paying customers – one you can adapt to your specific stage, category, and team size.
What Is App Growth – and Why Installs Are a Vanity Metric
App growth is a practice of increasing the long-term value of a mobile application through systematic experimentation across the entire post-install user journey: activation, engagement, retention, monetization, and referral.
The critical word is “long-term.” An app that spikes to 100,000 installs in a week and retains 3% of them after 30 days has not grown. It has spent money. Growth requires compounding – each cohort of users generating enough retained value and organic referrals to justify the cost of acquiring the next cohort, with improving unit economics over time.
This is why installs, in isolation, are a vanity metric. According to Business of Apps, approx. 68% apps is uninstalled within the first 30 days.
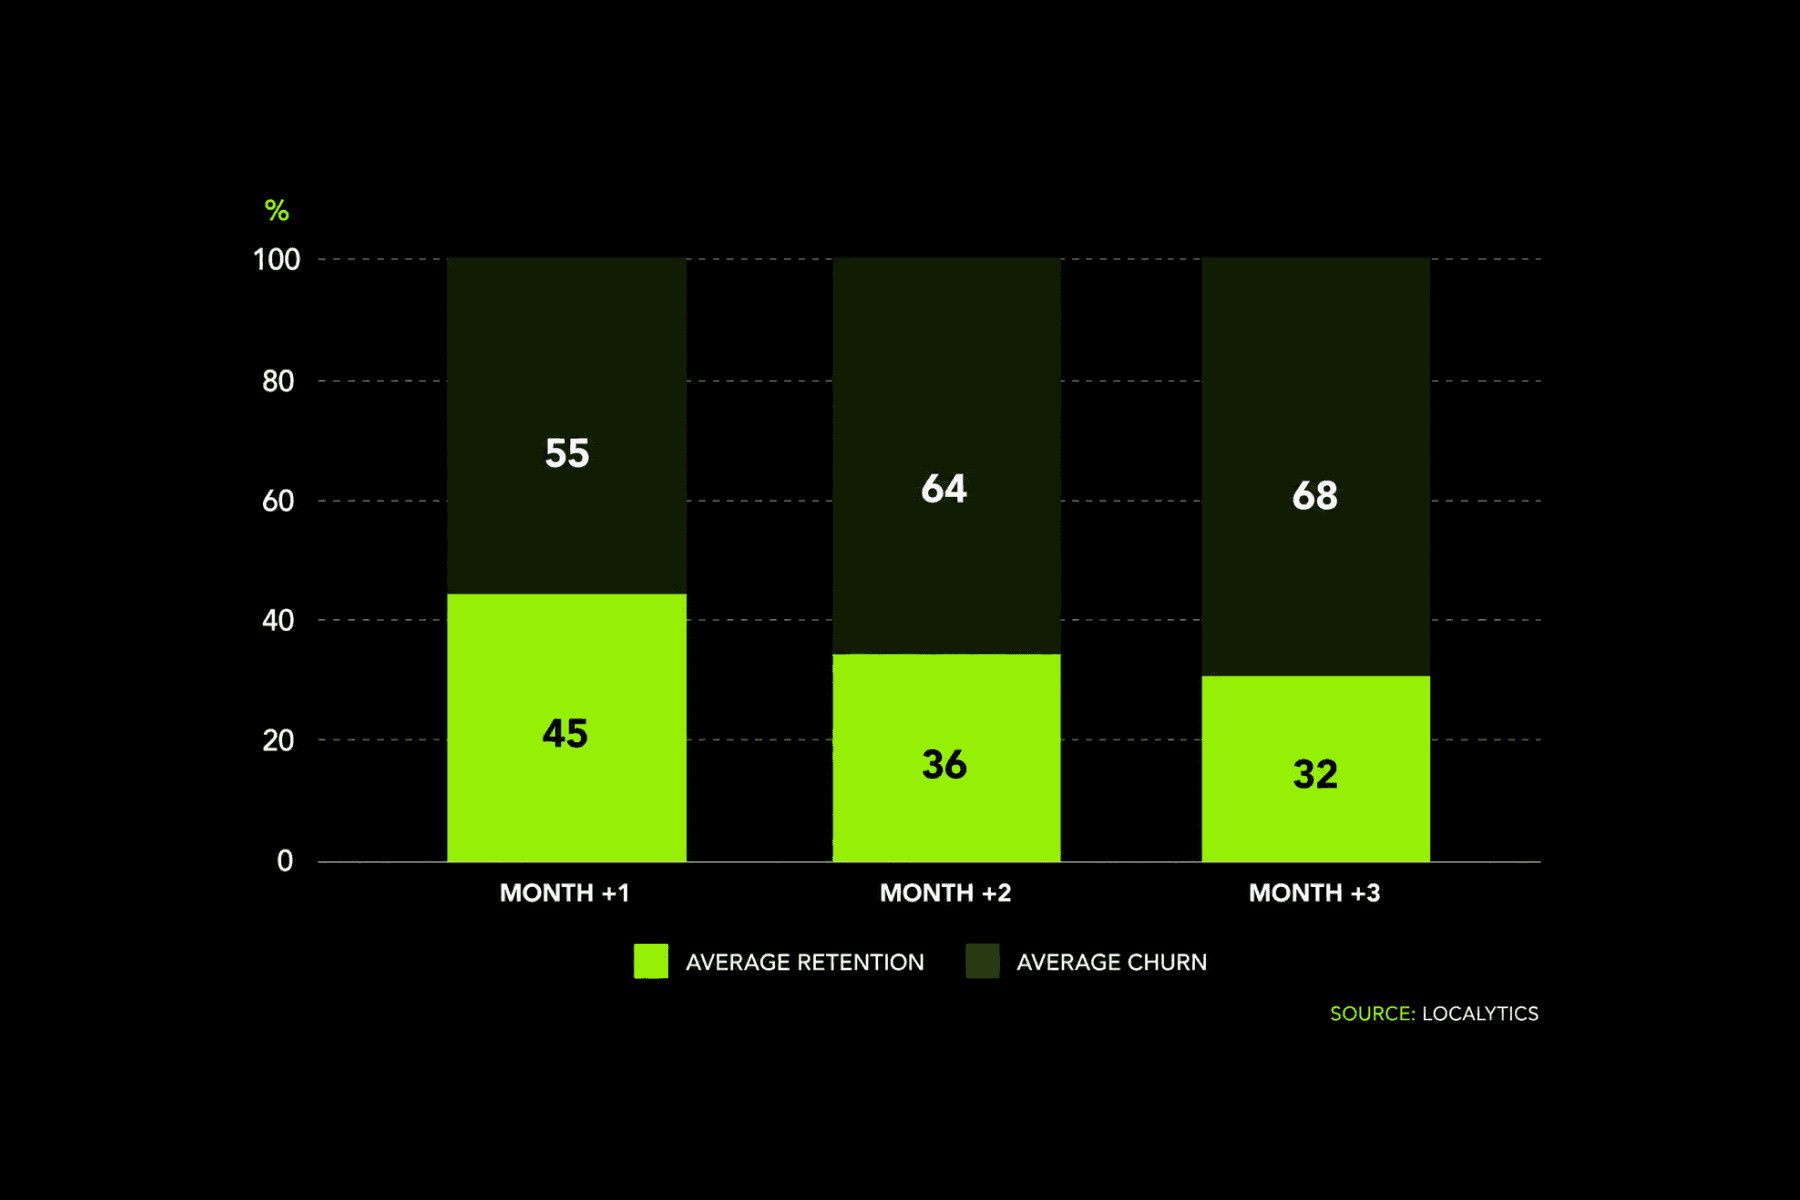
Among apps in the most competitive categories – social, fitness, fintech – the uninstall rate within 30 days can exceed 70%.
An install is a cost. An activated, retained, monetized user is a result. The gap between those two things is where growth strategy lives.
Growth Loops vs. Funnels: Why Linear Thinking Fails
Most app teams still think in funnels:
awareness at the top 🡹
conversion at the bottom🡻
⬄and a straight line from impression to revenue.
Such funnel model is useful for marketing – it maps how users discover and install your app. But it fails as a growth model because funnels are linear and one-directional. A user enters at the top and exits at the bottom. Nothing feeds back.
Growth loops, by contrast, are circular. The output of one stage feeds the input of the next. As Brian Balfour, co-founder of Reforge and former VP Growth at HubSpot, has argued, modern growth teams increasingly think in terms of loops rather than funnels, designing systems where existing users generate the conditions for new users.
Here is what a growth loop looks like in practice:
A new user is acquired → they activate by reaching a meaningful first action → the product experience engages them enough to return → they are retained through habit-forming mechanics → they generate revenue through subscriptions, purchases, or upgrades → they refer others who begin the loop again.
The power of a loop versus a funnel is that loops compound. If your K-factor – the average number of new users each existing user generates – exceeds 1.0, every cohort is larger than the last without additional acquisition spend. Even a K-factor of 0.3 or 0.4 meaningfully reduces your customer acquisition cost over time.
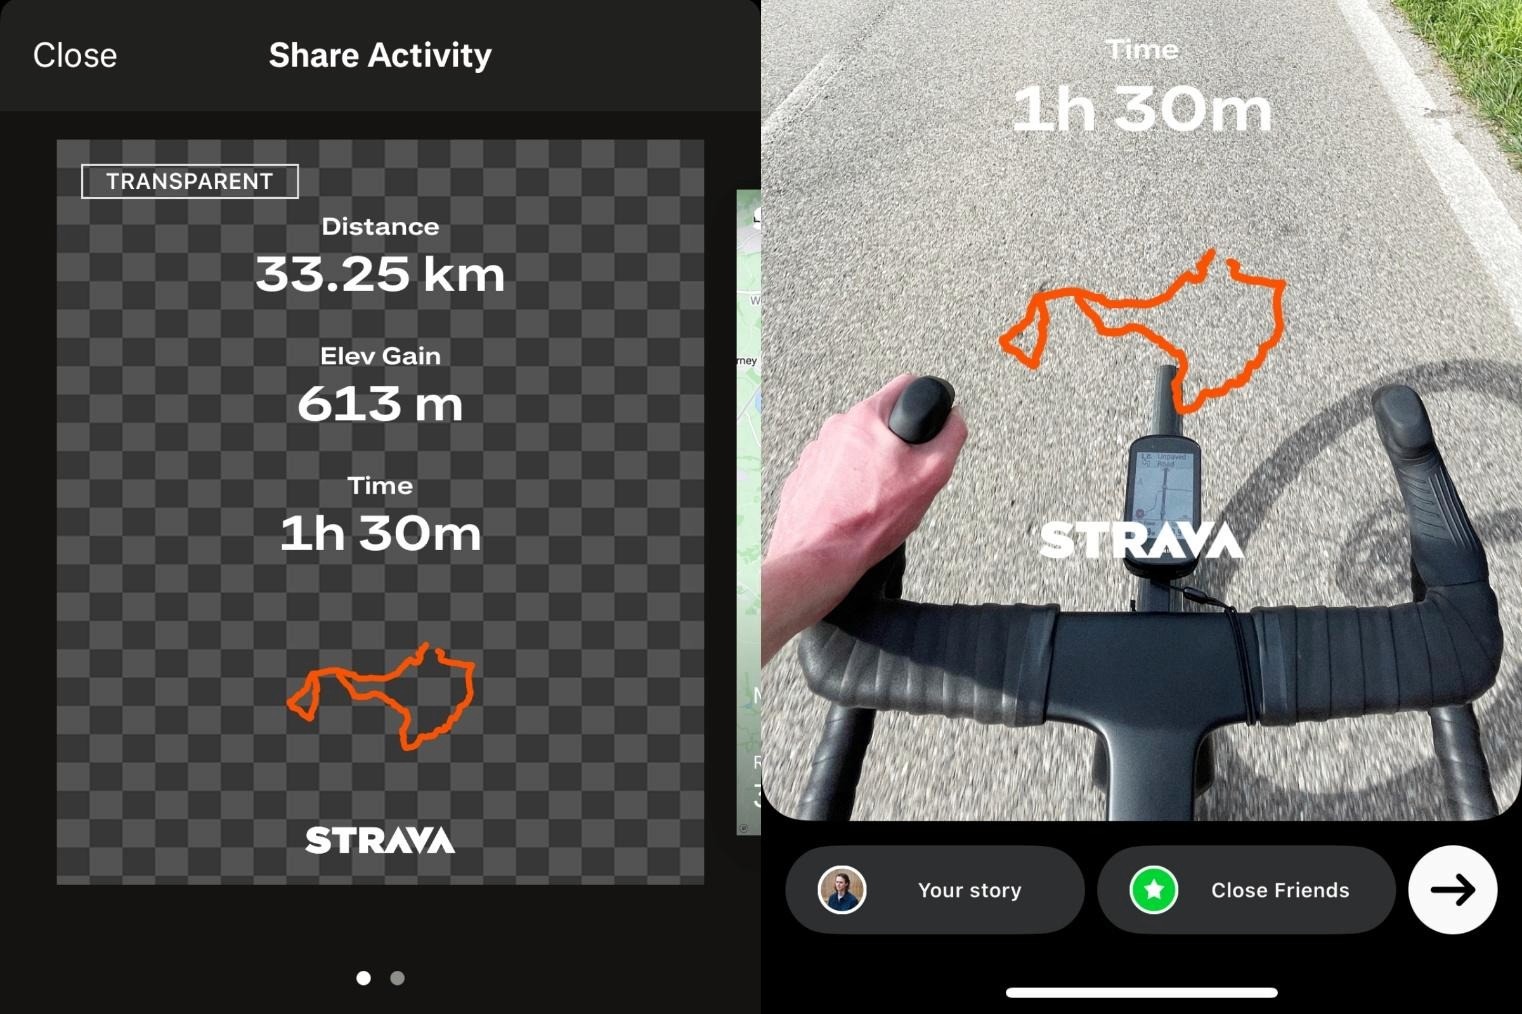
For example: Strava, a fitness tracking platform with over 135 million users, operates a textbook growth loop. Users track a run → the app generates a shareable activity card → the card gets posted to Instagram Stories or shared directly with friends → friends see it, download Strava → they track their own run → the cycle repeats. Strava’s product experience is the acquisition channel. The loop compounds without additional spend at each cycle. |
Choosing Your North Star Metric
A North Star Metric (NSM) is the single metric that best captures the core value your app delivers to users. Getting this right is one of the highest-leverage strategic decisions your growth team makes – because it aligns every experiment, every team priority, and every sprint goal around a shared definition of what success actually looks like.
The NSM is not a business metric like revenue or DAU. It is a value metric – one that, when it increases, causes both user satisfaction and business outcomes to improve in tandem.
Here are examples from well-known apps:
App | North Star Metric | Why It Works |
Uber | Rides completed per week | Directly measures value delivered to riders and drivers |
Weekly active pinners (users who save content) | Saving = finding value; saving predicts retention | |
Noom | Meals logged per user per week | Logging meals = engaging with the weight loss program |
Slack | Messages sent within a team per day | Team messaging = the core value proposition being used |
Figma | Active editors per file per week | Collaboration is the product; more editors = more value |
To choose your NSM, ask: what is a single user action that, when it happens, proves that this person is getting the value our product promises? If that action increases, everything else – retention, revenue, referrals – follows.
Pro Tip: Your North Star Metric should be something your growth team can directly influence through experiments. “Revenue” is too downstream. “App opens” is too shallow. The NSM should sit in the middle – close enough to user behavior that experiments can move it, close enough to business outcomes that leadership cares about it.
The Growth Experimentation Framework
In my experience, the fundamental difference between an app that grows and an app that stalls is not the quality of individual ideas. It is the speed and rigor with which those ideas are tested, measured, and either scaled or killed.
According to Harvard Business Review, companies that run over 10,000 online experiments per year – like Booking.com, Netflix, and Amazon – systematically outperform those that rely on intuition-based decision-making.
You do not need 10,000 experiments. But you DO need a repeatable system for generating hypotheses, testing them quickly, and learning from the results. Here is the framework I recommend.
ICE Scoring: Prioritizing Growth Experiments
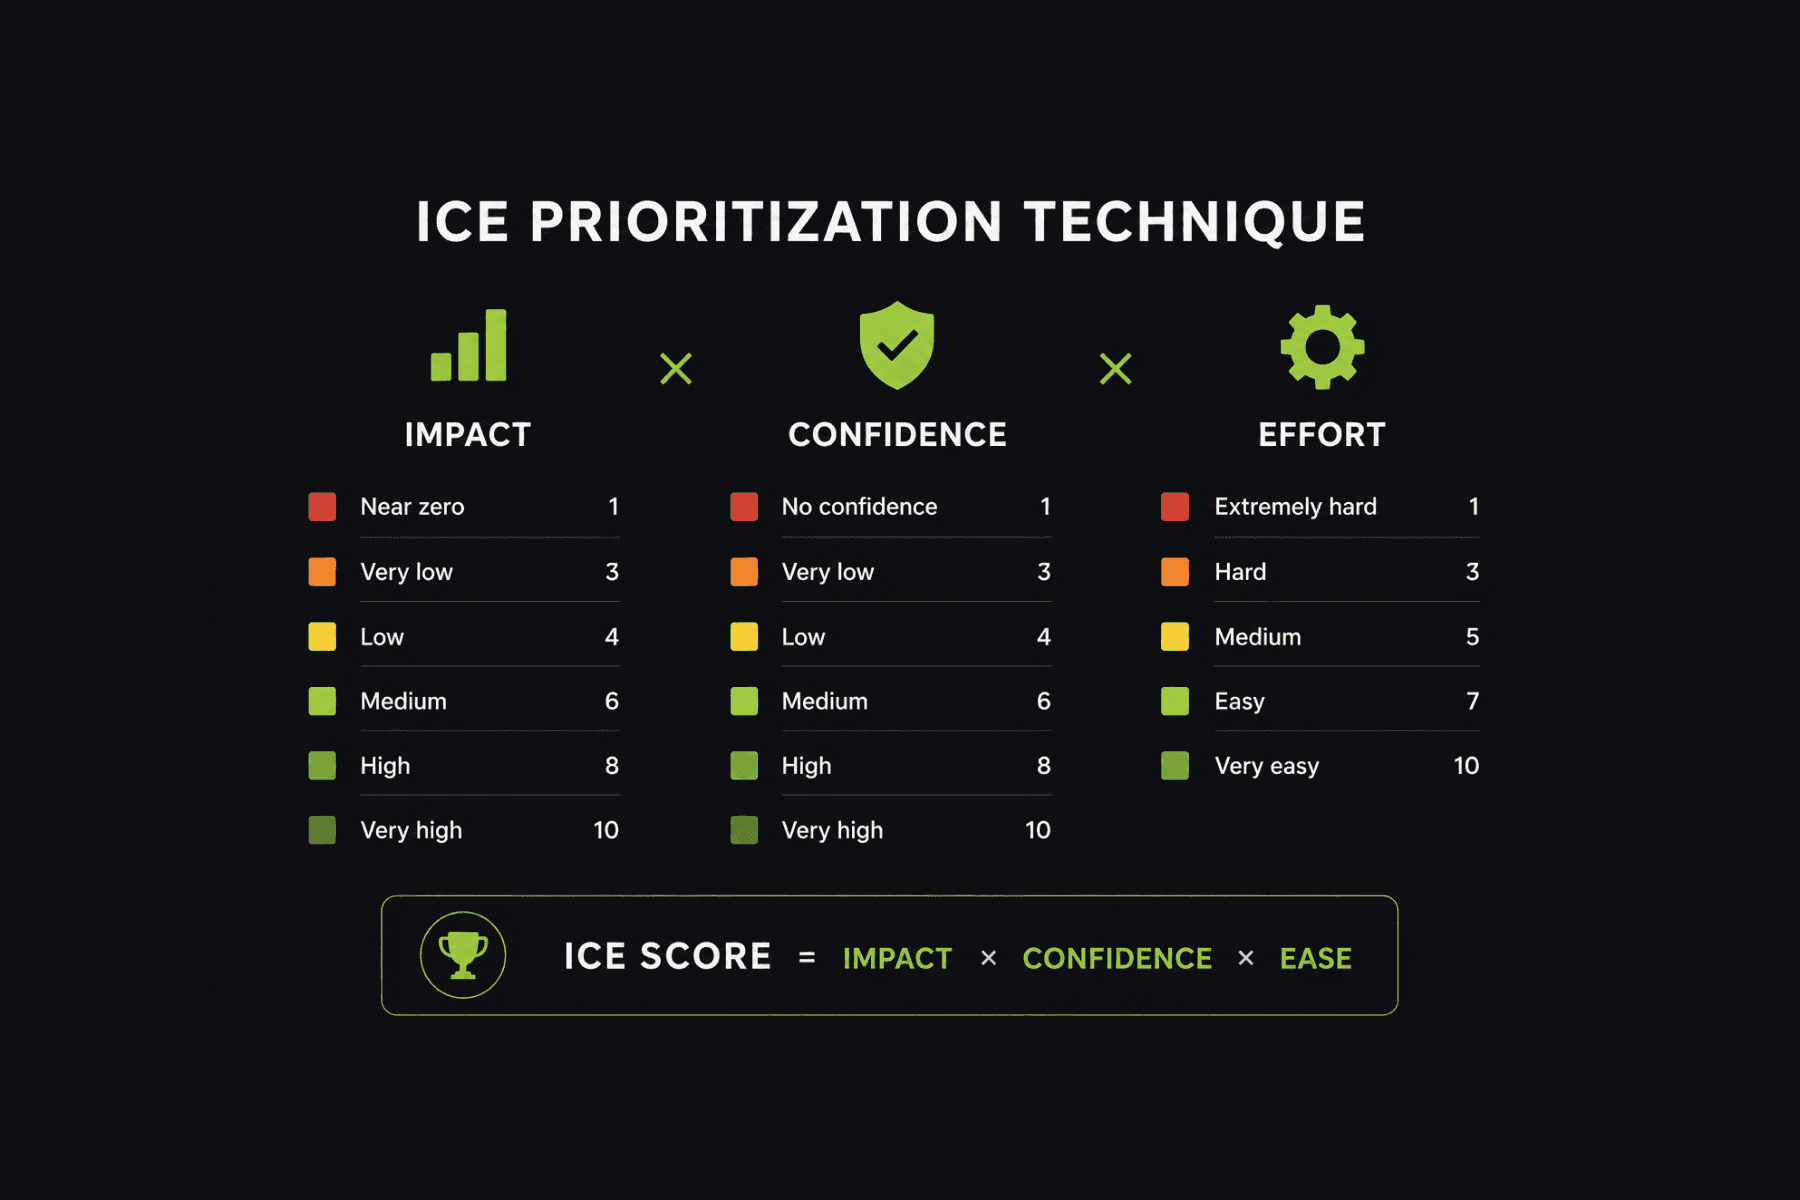
When you have 30 ideas and resources for 3, you need a framework to decide which ones to run first. ICE scoring – popularized by Sean Ellis, the founder of GrowthHackers and the person who coined the term “growth hacking” – evaluates experiments across three dimensions:
Impact (1–10): If this experiment works, how much will it move our North Star Metric?
Confidence (1–10): How confident are we, based on data or analogies, that it will work?
Ease (1–10): How quickly and cheaply can we run this experiment?
The ICE score is the total of all three. You rank experiments by score and run the highest ones first.
Experiment | Impact | Confidence | Ease | ICE Score |
Add 7-day streak challenge to onboarding | 8 | 7 | 9 | 504 |
Introduce personalized push based on usage patterns | 7 | 6 | 6 | 252 |
A/B test annual vs. monthly pricing as default | 9 | 5 | 8 | 360 |
Launch referral program with conditional rewards | 8 | 7 | 5 | 280 |
Redesign paywall with social proof elements | 7 | 6 | 7 | 294 |
The critical discipline is scoring before testing, not after. The value of ICE is in forcing your team to articulate why they believe something will work before they invest resources in finding out.
Running Growth Sprints: The 2-Week Experiment Cycle
A growth sprint is a structured two-week cycle: one week to design and ship the experiment, one week to measure and decide. The cadence keeps teams accountable and prevents experiments from drifting into multi-month projects that never produce a clear result.
The battle-tested sprint structure is the following:
Days 1–2: Define hypothesis. Format: “If we [change X], we expect [metric Y] to improve by [Z%], because [reason].”
Days 3–7: Build and launch the experiment. The faster you can ship, the more experiments you run per quarter. This is where low-code/no-code tools become a meaningful advantage – a growth team that can launch an engagement experiment (a new mission, a challenge, a reward mechanic) in hours rather than waiting for an engineering sprint can run 3–4x more experiments per quarter.
Days 8–12: Collect data. Ensure statistical significance before drawing conclusions.
Days 13–14: Decide: scale (roll out to 100% of users), iterate (modify and re-test), or kill (move on to the next experiment).
For example: Bumble, a mainstream dating app with over 50 million monthly active users, runs a rigorous experimentation program across its product experience. In one widely discussed experiment, they tested showing “conversation starters” – suggested opening lines – to users who matched but had not yet messaged. The hypothesis was that reducing the activation energy of the first message would increase message send rates. The result: a meaningful increase in first-message rates, which directly improved match engagement and downstream retention. The experiment ran in a two-week cycle, and the winning variant was scaled globally. |
Product-Led Growth for Mobile Apps
Product-led growth (PLG) is a practice of using the product itself – not sales teams, not marketing campaigns – as the primary driver of customer acquisition, engagement, and expansion. In the mobile app context, PLG means building mechanics directly into the product experience that make users more likely to stay, pay, and invite others.
PLG companies grow revenue 30% faster than sales-led companies at the same stage. For mobile apps, where the product IS the entire customer experience – there is no salesperson, no account manager – PLG is not a strategy option. It is the only viable approach for sustainable app growth.
In-App Experiments That Drive Retention
The highest-leverage growth experiments are not about your app marketing channels. They are about what happens inside your app after the install. Here are 3 categories of in-app experiments that consistently produce measurable retention improvements in the products I've worked with:
#1. Onboarding flow variants
Run A/B tests on:
the number of screens in your onboarding flow,
the order in which features are introduced,
whether you require account creation before or after delivering first value, and
what “first value” actually looks like for different user segments.
#2. Feature discovery experiments
Most apps have features that correlate with high retention but are used by a minority of users. Test different ways of surfacing them:
tooltips
guided tours
missions that reward first use
contextual prompts triggered by specific behaviors.
Track activation rate per feature and correlate it with D30 retention.
#3. Engagement mechanic tests
Test different mechanics to see which drives the strongest daily return rate:
streak-based challenges vs. points accumulation
time-limited quests vs. always-on missions
leaderboards vs. personal progress tracking.
Each app category responds differently to these mechanics, and assumptions are consistently wrong until tested.
For example: Canva, a leading design platform with over 220 million monthly active users, ran extensive onboarding experiments to find the optimal “first creation” flow. They tested whether users should be dropped into a blank canvas (maximum creative freedom) or guided through a template-based first design (minimum friction). The template-guided flow produced significantly higher retention among new users, because it delivered a completed design – tangible value – within the first minutes. That insight reshaped their entire onboarding architecture. |
Viral Loops & the K-Factor: Engineering Organic Amplification
The K-factor is the mathematical expression of your app’s viral potential:
K = invites sent per user × conversion rate of invitations
If K > 1, every user generates more than one additional user, and your app grows exponentially without additional acquisition spend. If K = 0.5, your acquisition costs are effectively halved because every two users organically generate one more.
Very few apps sustain K > 1 for extended periods. But even modest K-factors – 0.2 to 0.5 – produce dramatic cumulative effects over time. The way to increase K is not to ask users to invite more people. It is to make the sharing itself inherently valuable.
Three design principles for viral loops that I’ve seen work consistently:
Make the shared artifact valuable on its own. When a Strava user shares their run summary, the recipient gets an interesting piece of content, whether or not they download the app. The shared thing has a standalone value.
Reduce friction in the invitation flow to near zero. Every additional tap between “share” and “sent” loses a percentage of potential virality. The best viral loops are one-tap.
Reward both sides, conditional on real engagement. Flat “give $5, get $5” bonuses reward signups, not engagement. Conditional rewards – where both parties earn only when the referred user completes a meaningful action – bring in higher-quality users with better downstream retention.
Pricing, Paywall & Monetization Experiments
Monetization is not separate from growth – it fuels it. Revenue enables reinvestment in product quality, which 🡪 improves retention, which 🡪 reduces churn, which 🡪 increases customer lifetime value, which 🡪 justifies higher acquisition spend. I'd encourage you to think of your paywall not as a gate, but as an experiment surface you optimize continuously.
Paywall Timing & Placement Testing
When you show the paywall matters as much as what is behind it. There are 3 dominant models, and the right choice depends on your category and user psychology:
Model | When Paywall Appears | Best For | Example |
Value-first | After the user has experienced core value 2–3 times | Meditation, fitness, learning apps | Noom shows the paywall after a user completes their first assessment and sees personalized plan |
Habit-first | After the user has formed a daily usage pattern (5–10 sessions) | Productivity, tracking, routine-based apps | Grammarly allows extensive free usage before surfacing Premium when users hit their writing limits |
Immediate | At first launch or within the first session | News, streaming, premium content apps | The New York Times shows the paywall after a 1-article free preview |
The experimentation opportunity here is substantial. In my experience, apps that continuously A/B test paywall design, timing, and pricing often achieve significant improvements in conversion rates compared to static paywalls – with observed gains commonly ranging from single-digit percentage uplifts to substantially higher increases in well-optimized experiments.
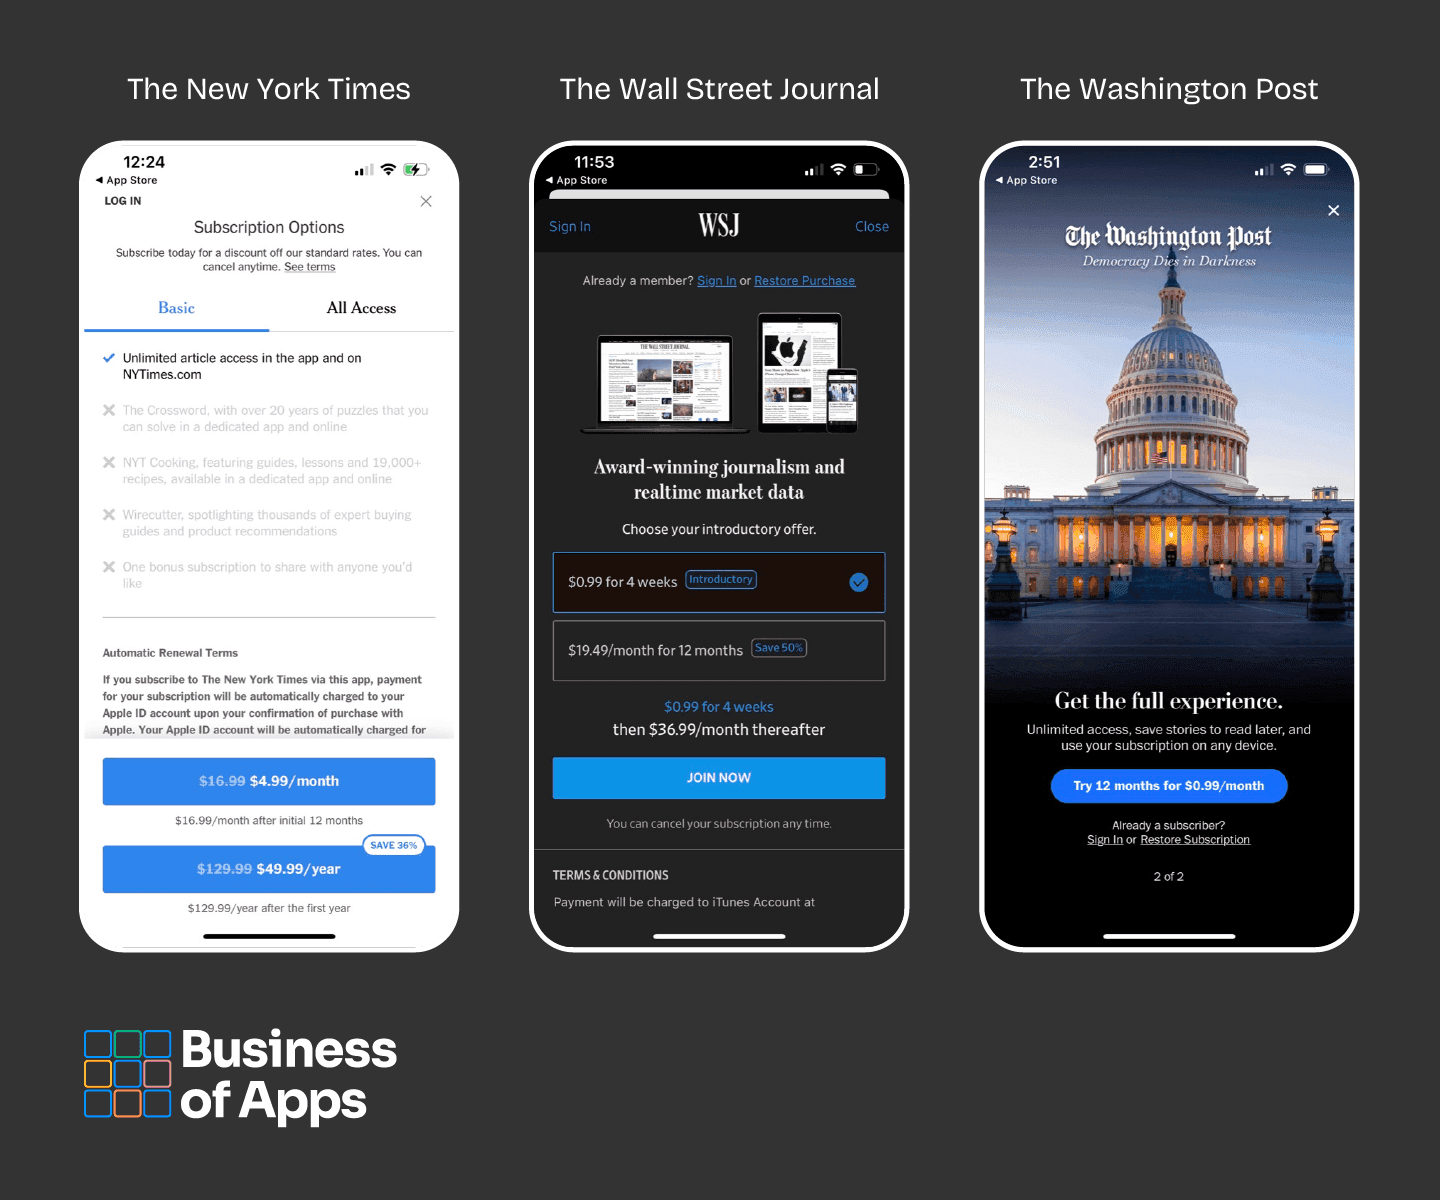
Paywall examples from News apps (Source: Paywall Screens)
Pro Tip: Test sequentially: first, test when the paywall appears (after onboarding vs. after third session vs. after feature limit hit). Then, once you have found the optimal timing, test what the paywall shows (feature comparison vs. testimonials vs. savings calculator vs. free trial offer).
Dynamic Pricing & Subscription Tier Optimization
Price is the single variable with the most direct impact on revenue, yet most apps test it the least. I see this constantly: the founding team picks a price during development based on competitive benchmarks and gut feeling, launches with it, and never revisits it. That is a significant missed opportunity.
The experiment that most reliably moves revenue: test showing annual pricing as the default versus monthly pricing. Annual plans have a higher upfront commitment but dramatically lower churn – most annual subscribers renew, while monthly subscribers churn continuously.

Other pricing experiments worth running:
Regional pricing: Adjust prices by market based on purchasing power. An app priced at $9.99/month in the US might convert at $4.99 in India, Southeast Asia, or Latin America.
Tier design: Test three tiers (Free / Pro / Premium) vs. two tiers (Free / Premium). The “decoy effect” – where a middle option makes the top option look more reasonable – is well-documented in behavioral economics.
Trial duration: Test 3-day vs. 7-day vs. 14-day free trials. Shorter trials create urgency. Longer trials build deeper habits. The optimal length depends on how quickly your app delivers its core value.
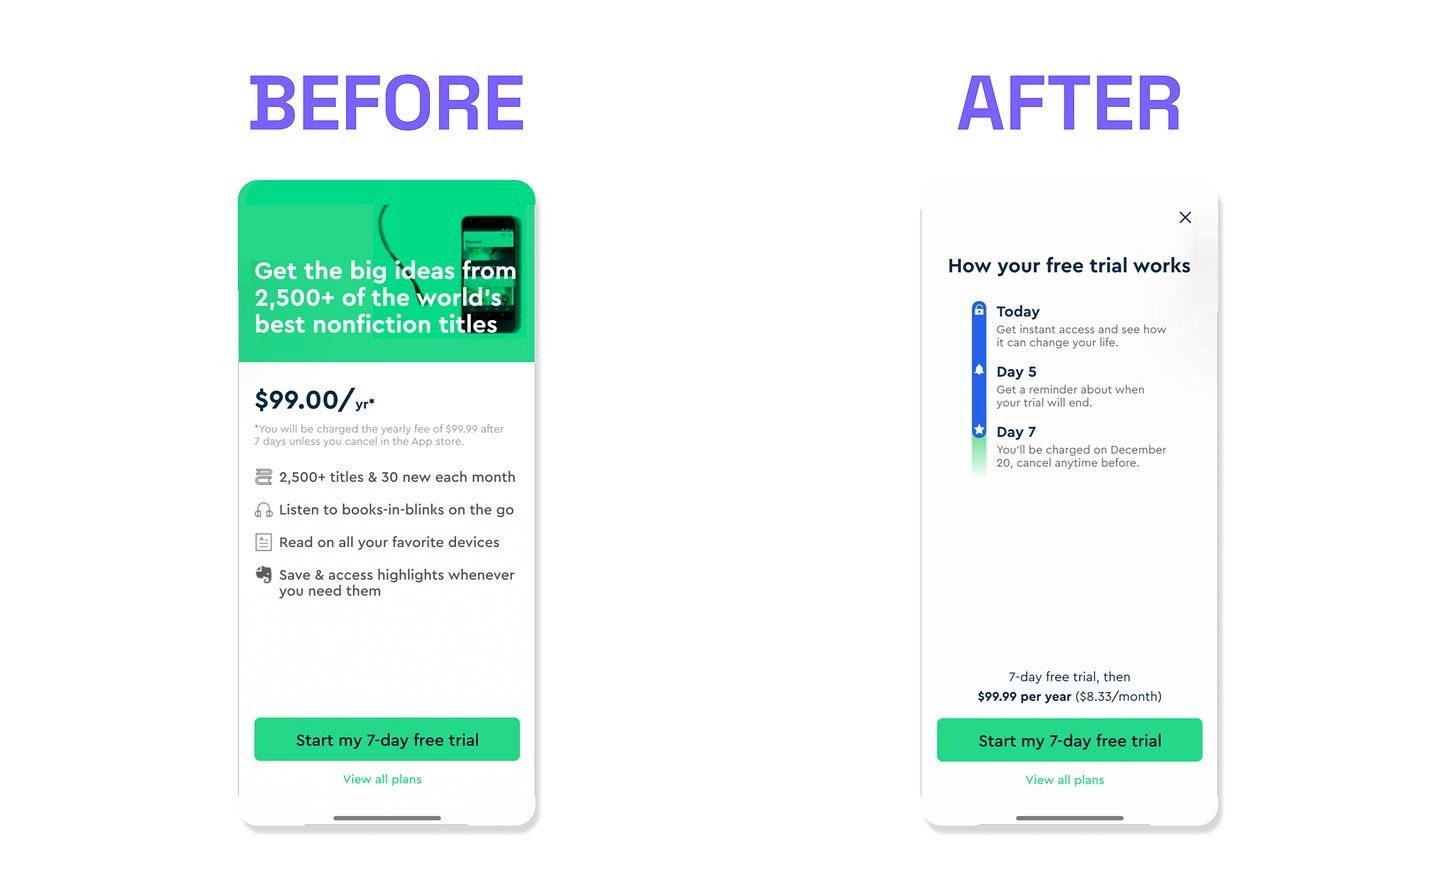
For example: Blinkist, the book summary app with over 23 million members, ran a paywall redesign experiment that produced one of the most striking results in subscription app monetization. Their data showed that 33% of all cancellations were happening on Day Zero – immediately after users started their free trial. The cause was trial fatigue: users were signing up with the intent to cancel before being charged, undermining the entire conversion funnel. Blinkist’s counterintuitive solution was to redesign the paywall to explicitly promise users a reminder notification two days before their trial expired – effectively making it easy to cancel. This built trust at the moment of highest skepticism. The results were remarkable: 1,200% increase in notification opt-in rates (from 6% to 74%), 23% more trial signups, 55% fewer customer complaints, and 4% higher trial retention. The lesson: reducing friction does not always mean removing the paywall. Sometimes it means removing the anxiety around the paywall. |
Seasonal & Event-Based Growth Campaigns
Growth is not constant. Every app category has natural peaks and valleys driven by cultural events, seasons, and behavioral shifts. In my experience, the apps that grow fastest are the ones that plan for these moments 4-6 weeks in advance and use them as structured experimentation windows – not the ones that scramble to build something when the moment has already arrived.
Planning Your Seasonal Growth Calendar
Map the calendar events that align with your app category’s natural demand spikes:
Period | Opportunity | App Categories | Growth Experiment |
January | New Year’s resolutions | Fitness, health, finance, learning, e-commerce | 30-day challenge with escalating rewards |
February | Valentine’s Day | Dating, gifting, food delivery | Limited-time social sharing features |
April–May | Spring / fitness season | Fitness, outdoor, wellness | Social leaderboard + referral bonus |
August–Sept | Back to school / work | Productivity, education, planning | Onboarding experiments for new user surge |
Nov–Dec | Black Friday / holidays | E-commerce, gaming, subscription apps | Annual subscription discount + gift mechanics |
For example: Peloton, the connected fitness platform, structures its entire content and engagement calendar around seasonal moments. Their “Annual Challenge”, which encourages users to log a specific number of workouts over the year, resets each January, creating a natural re-engagement trigger for dormant users. Seasonal challenges like “Spring Into Action” and holiday-themed workout series drive measurable engagement spikes. Users who participate in challenges demonstrate significantly higher class completion rates and subscription renewal rates compared to non-participants. |
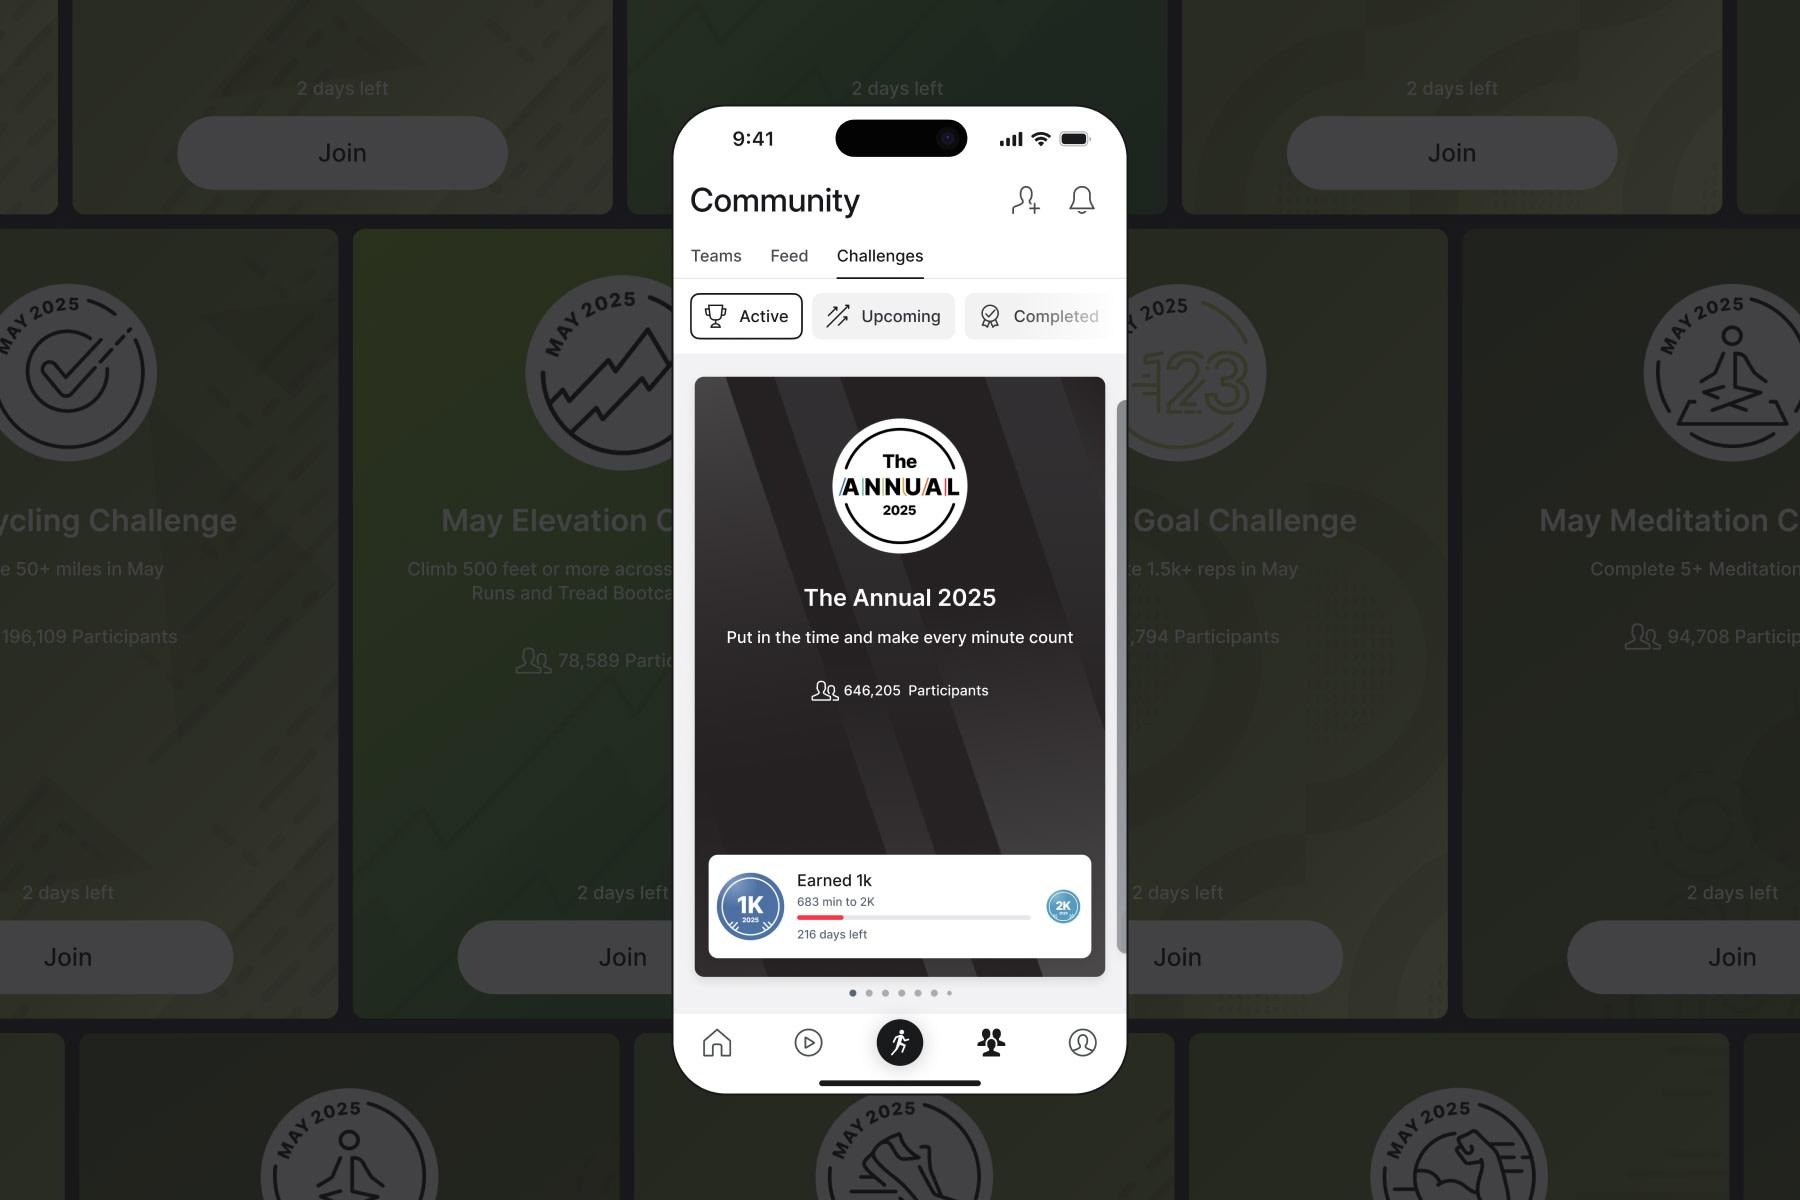
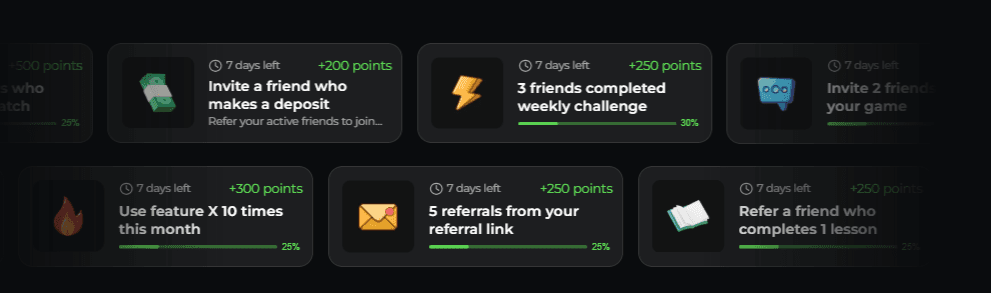
Pro Tip: Seasonal missions – “Complete 7 workouts this month to earn a holiday badge” or “Refer a friend during our anniversary week for double points” – are among the highest engagement mechanics available. They create urgency (time-limited), social proof (visible participation), and reward (points, badges, status). With Enable3, you can launch these time-limited missions without engineering support, at the speed the calendar demands.
Measuring Mobile App Growth: The Metrics That Actually Matter
Here, we’ll focus specifically on app growth metrics – the numbers that tell you whether your product experience is creating compounding value. These are the metrics that matter for your experimentation program, not just your reporting deck.
The App Growth Metrics Dashboard
Metric | Definition | Healthy Benchmark | What It Tells You |
D1 Retention | % of users returning 1 day after install | 25–40% (varies by category) | Is your onboarding delivering value fast enough? |
D7 Retention | % of users returning 7 days after install | 12–20% | Has the user formed an initial habit? |
D30 Retention | % of users returning 30 days after install | 6–12% | Is the product experience strong enough for long-term retention? |
DAU/MAU Ratio | Daily active users ÷ Monthly active users | 20–30% (good), 50%+ (exceptional) | How “daily” is your app? Higher = stronger habit |
Activation Rate | % of installs that complete a meaningful first action | 30–60% | Is onboarding converting installs into real users? |
LTV/CAC Ratio | Lifetime value ÷ Customer acquisition cost | 3:1 or higher | Is each user worth more than the cost of acquiring them? |
K-Factor | Invites sent per user × conversion rate | >0.2 (contributing), >1.0 (viral) | Is the product generating organic growth? |
Monthly Churn Rate | % of users lost per month | <5% (subscription), <8% (freemium) | How fast is the bucket leaking? |
Feature Adoption Rate | % of active users using a specific feature | Varies | Are users discovering the features that predict retention? |
The benchmarks in this table are drawn from publicly available industry data. They vary significantly by category – a social app with 15% D7 retention is performing differently from a utility app with the same number. Always benchmark against your own category, not an industry average.
Cohort Analysis: Reading Your Growth Story
Cohort analysis is the single most important analytical tool in your growth toolkit. It groups users by the week or month they first installed, then tracks how each group behaves over time. The resulting chart tells a story that no single metric can – and I'd argue you cannot responsibly run growth experiments without it.
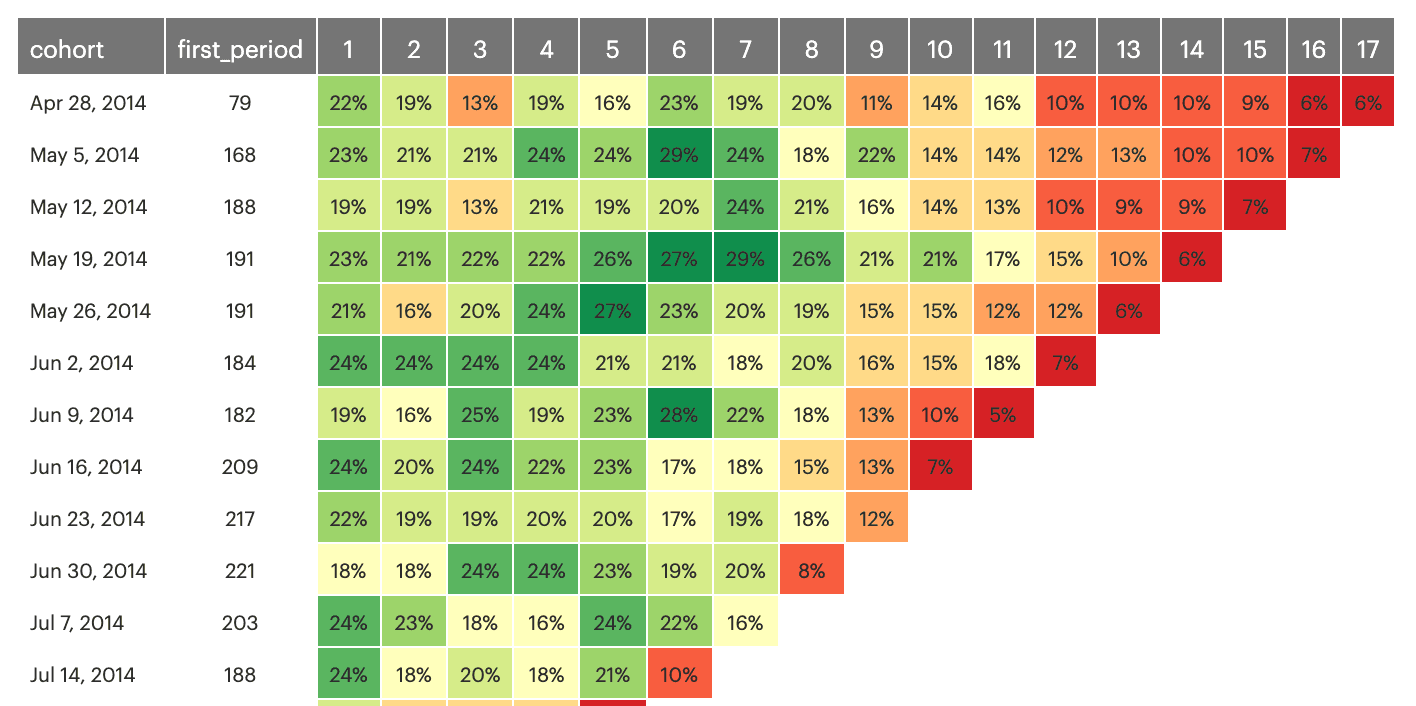
Example of app retention heatmap
What to look for:
The shape of the curve. A healthy retention curve flattens after an initial drop. If your D7 retention is 18% and your D30 retention is 14%, users who survive the first week are largely staying. If D7 is 18% and D30 is 4%, you have a second churn cliff – meaning your product engagement weakens after the initial novelty period.
Improving cohorts over time. If January’s cohort retained at 10% at D30, and March’s cohort retained at 14% at D30, your product improvements are working. This is the clearest signal that your growth experiments are producing compounding results.
Cohort-level feature correlation. Segment cohorts by whether they used a specific feature. If users who completed a “7-day challenge” in their first week retain at 2x the rate of users who did not, that feature is a retention lever – and you should experiment with ways to increase product adoption.
Pro Tip: Build your cohort dashboard before you start running experiments. Without it, you cannot measure the impact of anything. Integrate Enable3 with tools like Amplitude or Firebase to see built-in cohort views. The investment is a few hours of setup. The payoff is the ability to attribute every experiment to a measurable retention outcome.
Activation and Onboarding Strategies: Converting Installs into Retained Users
Activation is where most apps lose the most value – and the stage that receives the least strategic attention relative to its impact. In our experience, if a user does not complete a meaningful action in the first session, the probability they ever return drops below 20%. The window is narrow, but the opportunity is enormous.
Designing for the “Aha” Moment, Not for Feature Education
The most common onboarding mistake we see at Enable3: treating the first session as a product tour. Your users did not download your app to learn about your features. They downloaded it because they have a specific problem they want to solve. Your onboarding job is to solve that problem – or show them it can be solved – as fast as possible.
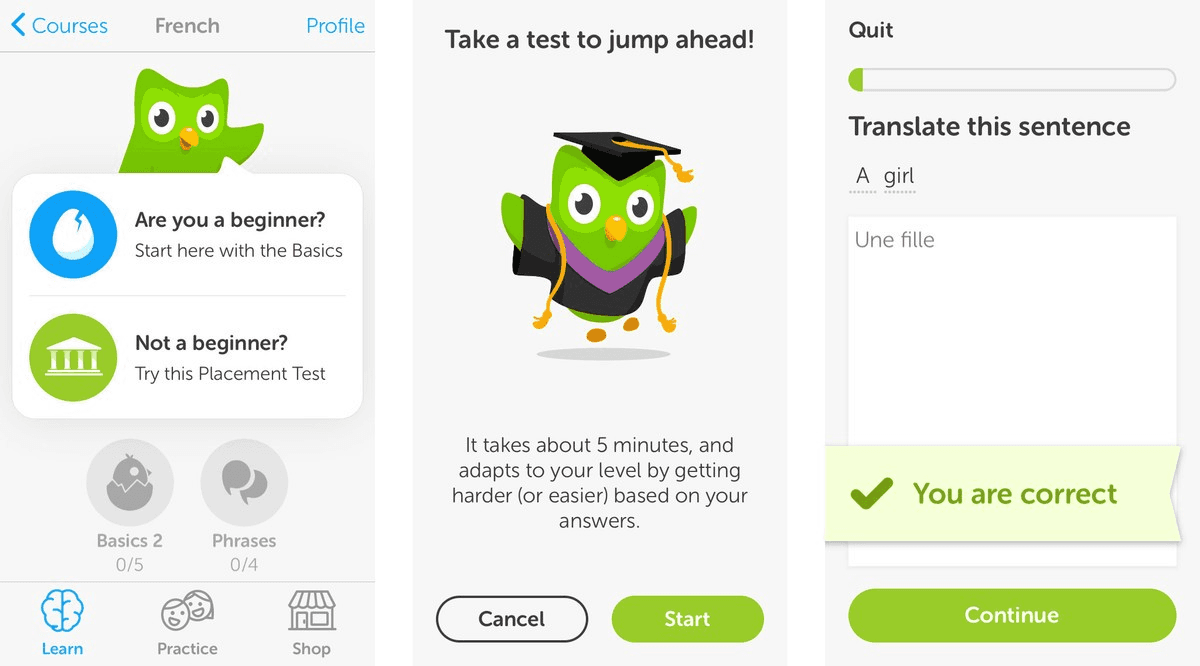
Duolingo's onboarding starts with a lesson, not a sign-up form. Spotify builds your first playlist before asking for a credit card. Notion's onboarding creates a usable workspace before explaining blocks. In each case, the product defers the friction and leads with the value. The sign-up, the preferences, the profile – these come after the user has already experienced something worth returning for.
Pro Tip: Measure what percentage of new users reach your defined activation event in their first session. If it is below 50%, work backward through every step between install and that event and ask: which ones are necessary, and which ones are just there because they were easy to build?
Rewarding Onboarding Milestones to Compress Time-to-Value
One mechanic that consistently improves activation rates is attaching a reward to specific onboarding milestones. This is not a points-for-everything approach – it is a targeted incentive for the two or three actions that most predict long-term engagement.
In practice: a fitness app might reward users with a badge and a free premium week for completing their first workout and logging their first meal. A fintech app might reward users for completing identity verification and making a first transaction. Each reward serves a dual purpose: it incentivizes the action and it introduces the loyalty mechanic that will keep users engaged after onboarding ends.
With Enable3, you can configure event-based missions that fire the moment a specific action is completed in your app – no deployment sprint required. Your marketing team configures the trigger and the reward through an admin panel; the engineering integration is a one-time event setup. That separation means your growth team can iterate on onboarding experiments at the speed experiments need to run.
Proven Post-Onboarding App Retention Strategies: Turning Cohorts into Compounding Revenue
Here is the math that most app growth teams have not run explicitly: if your monthly churn rate is 10%, you lose 70% of your users within 12 months. If you reduce monthly churn to 7%, you retain 57% after 12 months – nearly double. The LTV difference is not marginal; it is transformational for unit economics. This is why app retention strategy deserves the same rigor as customer acquisition strategy – and usually gets a fraction of the investment.
App retention strategy operates on three-time horizons: early (Day 0–14), mid (Day 15–90), and long-term (90+ days). Each requires different mechanics because the reasons for potential churn are different.
Early Retention: Closing the Onboarding-to-Habit Gap
The biggest churn risk is Day 1 to Day 7. Users who complete onboarding but do not return within a week almost never become retained users. Beyond the activation tactics covered above, the key addition for early retention is building a day-2 hook into your onboarding. Not a push notification – an in-product reason to return tomorrow that is set up on Day 1.
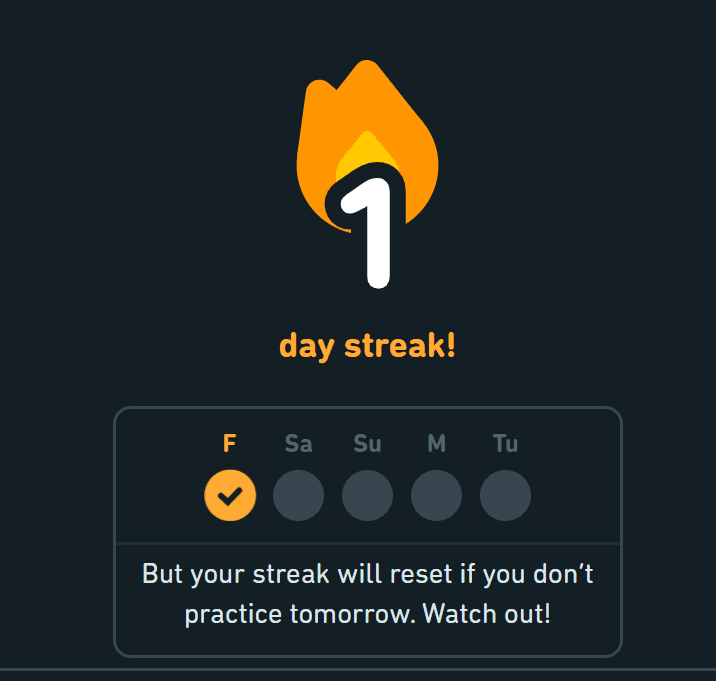
For example: Duolingo sends a notification 24 hours after the first lesson completion: "Your 1-day streak is at risk." The streak started in the first session. The notification is not promotional – it references real progress the user made. This is the day-2 hook: an action taken in the first session that creates an obligation to return in session two. |
Mid-Retention: Deepening In-App Engagement Before Novelty Fades
Weeks 2 through 12 are where most apps lose the middle cohort – users who completed onboarding and used the app a few times but never formed a deep habit. The novelty has faded; the routine has not yet formed. This is the window where lifecycle messaging and progression mechanics are most impactful.
Tactics that consistently move mid-retention metrics, based on what we’ve seen work at our clients:
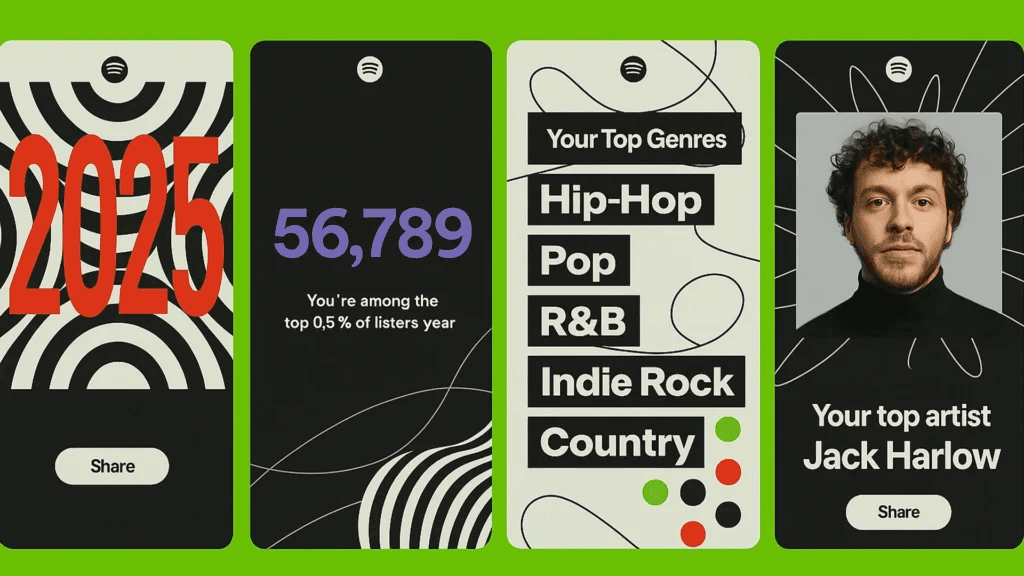
Tier progression: Giving users a visible status they are working toward creates ongoing motivation. Spotify's Wrapped campaign – showing users their year in music – works partly because it makes users feel they have built something (a listening history) that is worth protecting. Sephora's Beauty Insider tier system, which drives 80% of total company sales, keeps users engaged between purchases because they are maintaining status, not just spending money.
Feature adoption campaigns: Users who adopt multiple features churn at lower rates than single-feature users. Targeted in-app messages introducing features the user has not tried – timed to moments of high engagement, not arbitrary schedules – consistently improve 30-day retention.
Personalized re-engagement: Generic "We miss you" push notifications produce minimal results. Campaigns that reference specific past behavior – "You logged 4 workouts last month. Your streak resets in 2 days" – outperform generic re-engagement by 3–5x in open rate and session reactivation.
Long-Term Retention: Loyalty as a Structural Advantage
Users who have been active for 90 days are not the same retention risk as new users. But they are not immune to churn either. The churn drivers at this stage are different: competitive alternatives become more relevant, the product has become familiar (possibly boring), and there is no escalating stake in continuing to use it.
The apps that retain users through month 6, 12, and beyond have built a structural loyalty marketing strategy based on switching costs – not contract-based, but value-based.
For example: Revolut users who have accumulated Premium rewards, earned cashback, and built a financial history in the app have something to lose by switching. Strava users with two years of runs, a network of followers, and segment records do not want to start over elsewhere. The product has accumulated value that belongs to the user. Loyalty tiers, points balances, achievement histories, and community reputation are all forms of accumulated value. They do not prevent churn, but they substantially raise the bar for it. Nike's Membership program – 100+ million members who spend 3x more than guest customers – is built on this principle. |
Gamification Mechanics That Drive Sustainable App Engagement Strategy
Gamification is the most misused word in mobile app growth. When teams say "add gamification," they usually mean "add a leaderboard and some badges." In my opinion, that is decoration, not gamification. Real gamification ties game mechanics to the specific behaviors that drive your core business metrics.
The gamification mechanics with the most consistent impact on app engagement metrics - based on what we've observed across products:
Streaks: Daily consistency rewards that build habit loops through loss aversion. Most effective when the streak represents something the user genuinely values – learning progress, fitness consistency, financial discipline.
Mission-based challenges: Time-bound actions with clear rewards. "Complete three workouts this week to unlock this badge" produces higher completion rates than open-ended point accumulation because the goal is concrete and the timeframe is defined.
Progress bars and tier advancement: Visual progress toward a defined threshold creates completion motivation. Users who can see they are 80% of the way to Gold tier will make purchasing or usage decisions to reach it that they otherwise would not.
Leaderboards (with caveats): Effective for competitive user segments. Counterproductive for users who are near the bottom, as they typically disengage rather than compete. Contextual leaderboards – showing only users within 10 ranks of you, or only your friend group – perform better than global rankings.
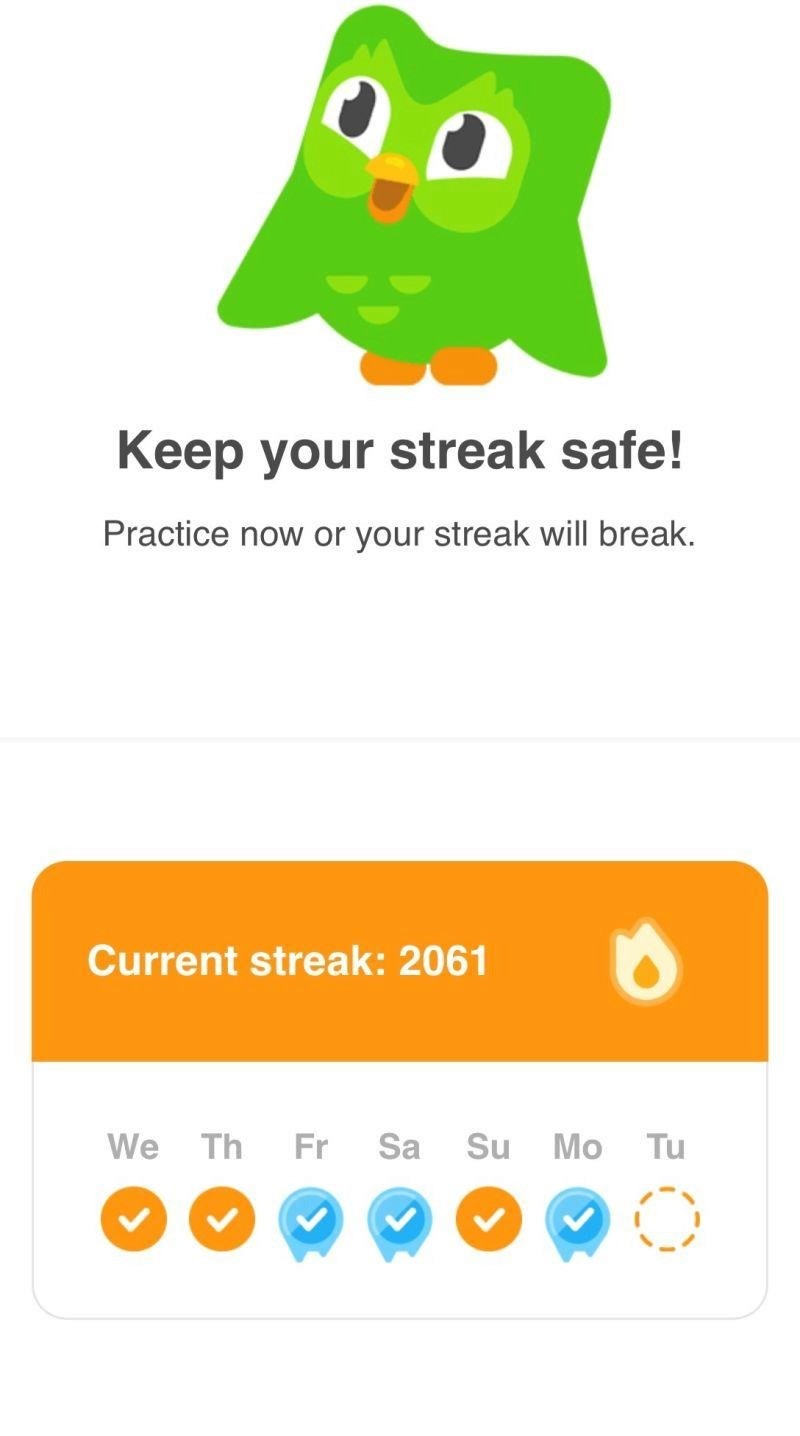
For example: Duolingo's streak is a gamification mechanic, but it is also a retention mechanic. A broken streak is not just a game loss – it is a real psychological cost. Duolingo reported that streak-related features drove a measurable improvement in DAU. The game mechanic and the retention metric are the same thing. |
Common App Growth Mistakes That Stall Teams Between 10k and 1M Users
These are not theoretical mistakes. At Enable3, we’ve seen each of these patterns repeatedly –and each one has a measurable cost attached.
Treating DAU growth as proof of retention health
Daily active users can grow while cohort retention is declining – if acquisition volume is high enough. Always segment DAU by acquisition cohort. If new cohorts are retaining worse than older ones, growth is on borrowed time.
Building engagement features without tying them to business metrics
Push notification open rates, gamification participation, and loyalty redemption rates are engagement signals, not business outcomes. The question is always: does this engagement mechanic correlate with reduced churn, higher ARPU, or increased K-factor? If you cannot draw that line, you are building activity, not growth.
Scaling paid acquisition before retention is proven
Doubling UA spend with a 10% Day 30 retention produces twice the leaky bucket, not twice the growth. The sustainable app growth sequence is: prove retention → prove unit economics → scale customer acquisition. Most teams do it in reverse and wonder why growth is expensive.
Running re-engagement campaigns at the wrong stage
Win-back campaigns for users who have been dormant for 90 days produce single-digit reactivation rates. The same effort applied to users at 14 days of inactivity – before they have mentally "left" – produces dramatically better results. Segment your dormant users by recency and weight your re-engagement spend accordingly.
Treating referral as a passive feature rather than an active program
Most apps have a referral link somewhere. Very few have a referral program – a system that identifies high-advocacy users, incentivizes them at the right moment, and tracks referral quality rather than referral volume. The difference in outcomes is substantial.
Optimizing the wrong stage because it is the most measurable
CPI is easy to measure. Day 30 retention is harder. LTV is the hardest. Teams consistently over-optimize for the metric they can measure most easily and under-invest in the stages that drive long-run growth value. Build the measurement infrastructure for the full funnel before letting easy metrics drive strategy.
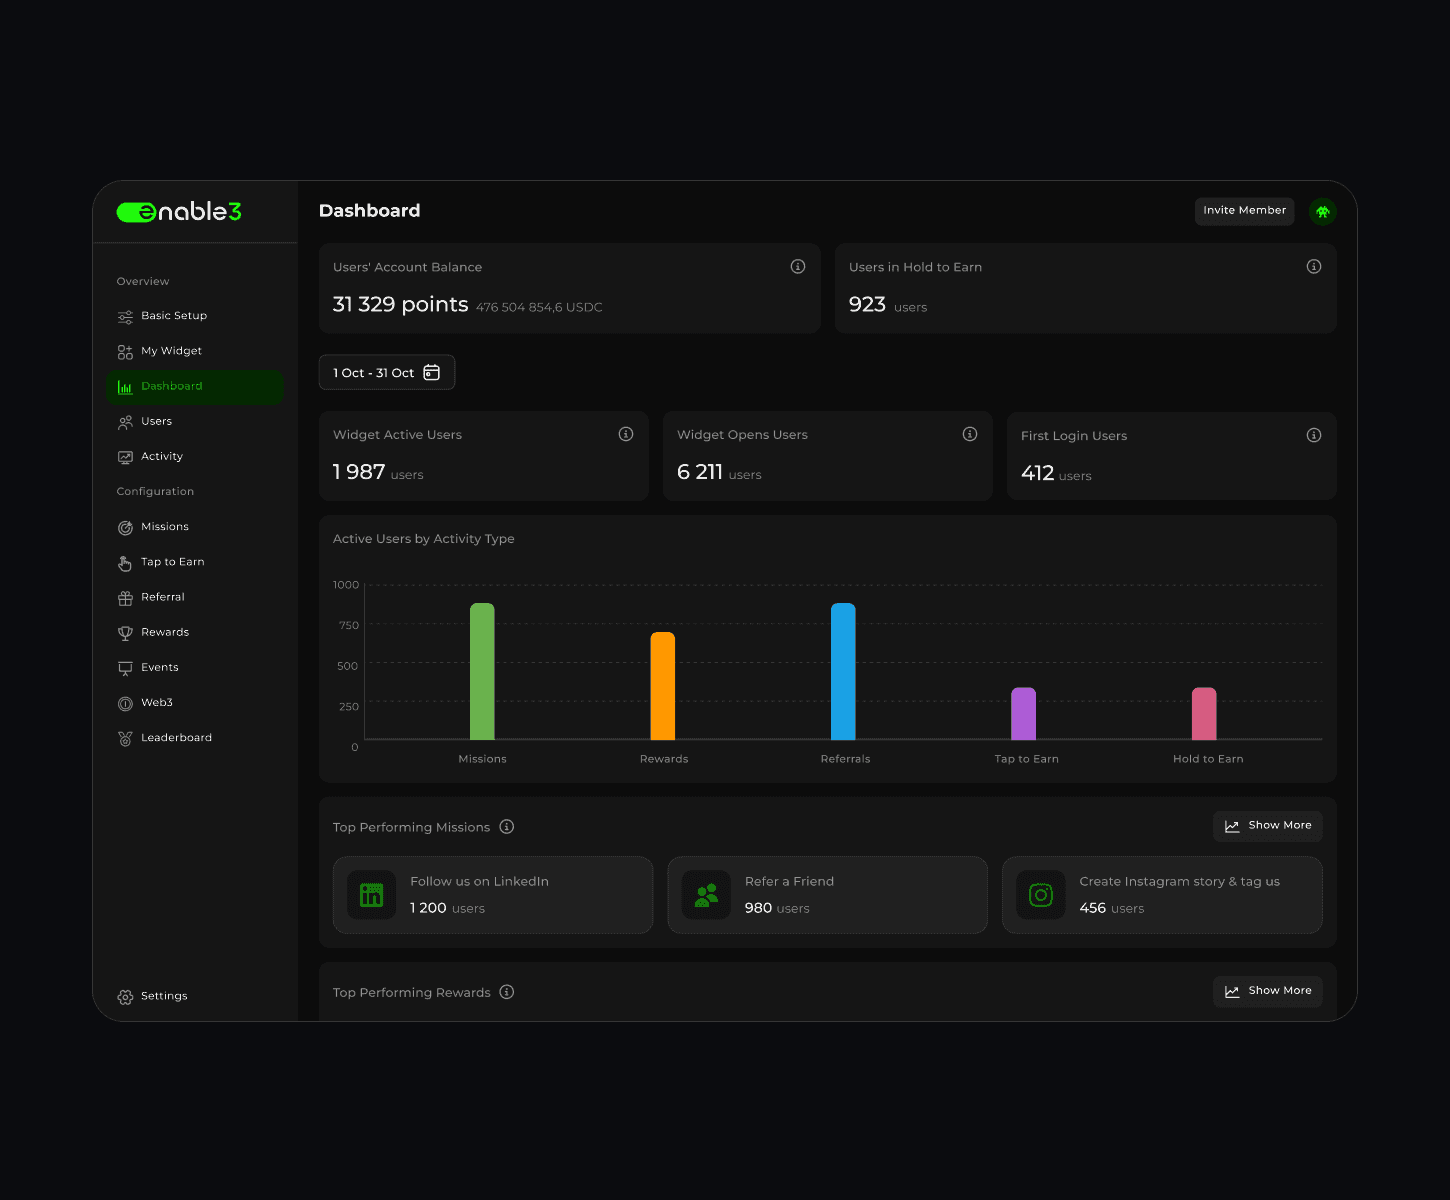
How Enable3 Can Power Your App Growth
Running growth experiments is the strategy. But shipping them fast enough to learn at the pace the market demands — that is the operational challenge. Most growth teams are bottlenecked not by ideas, but by implementation speed. Here is where Enable3 removes the bottleneck.
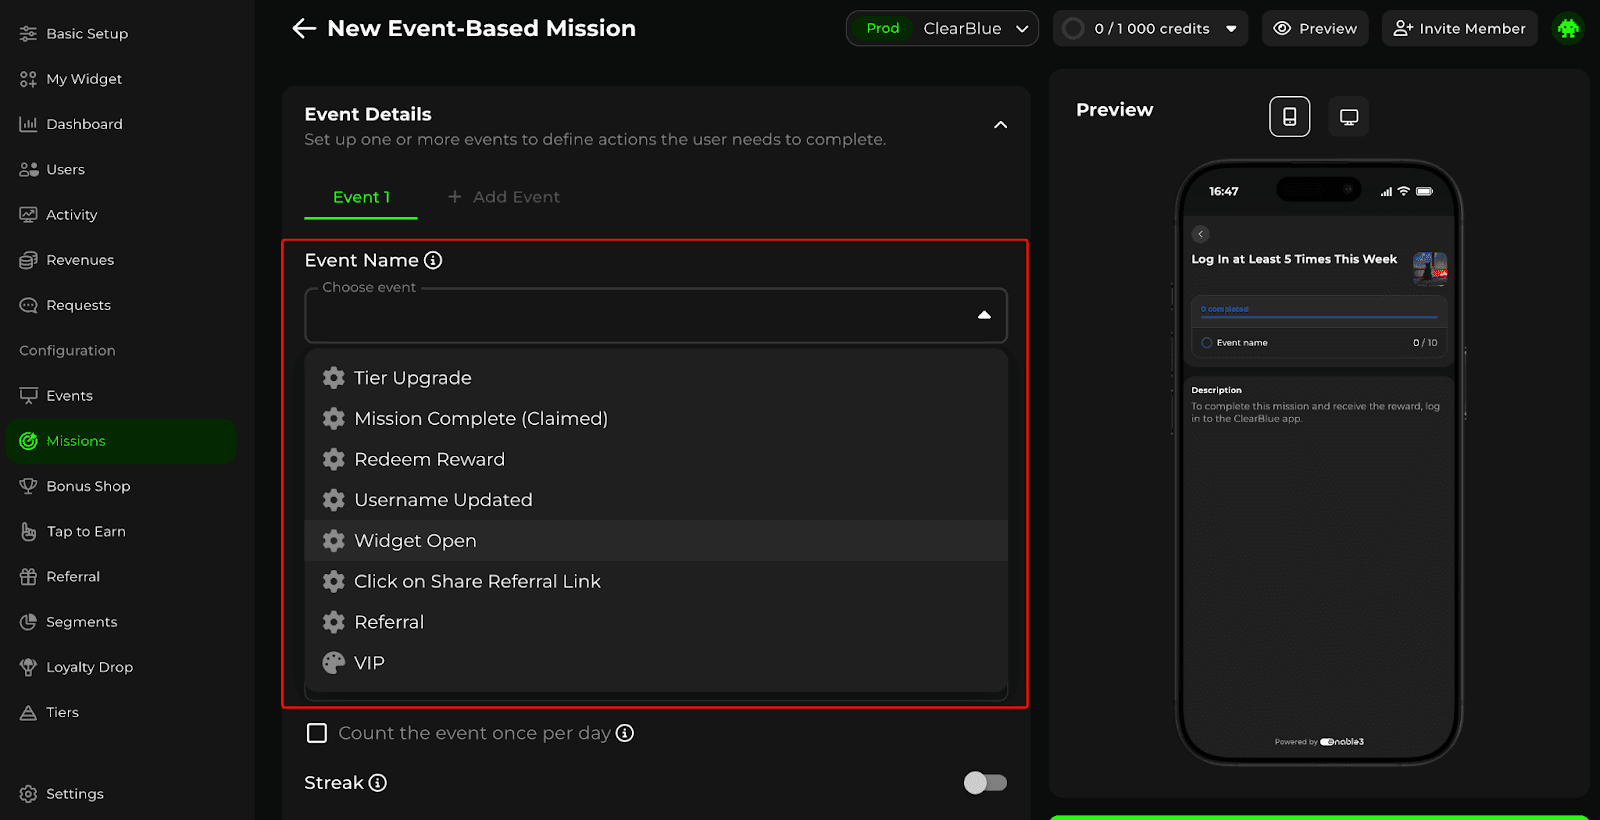
Problem #1: Your growth experiments take weeks to ship
You have a hypothesis: “If we add a 7-day streak challenge for new users, D7 retention will increase by 15%.” The growth PM writes the spec. It goes into the engineering backlog. It competes with bug fixes and feature work. Three weeks later, it ships. Two weeks after that, you have results. Five weeks for one data point.
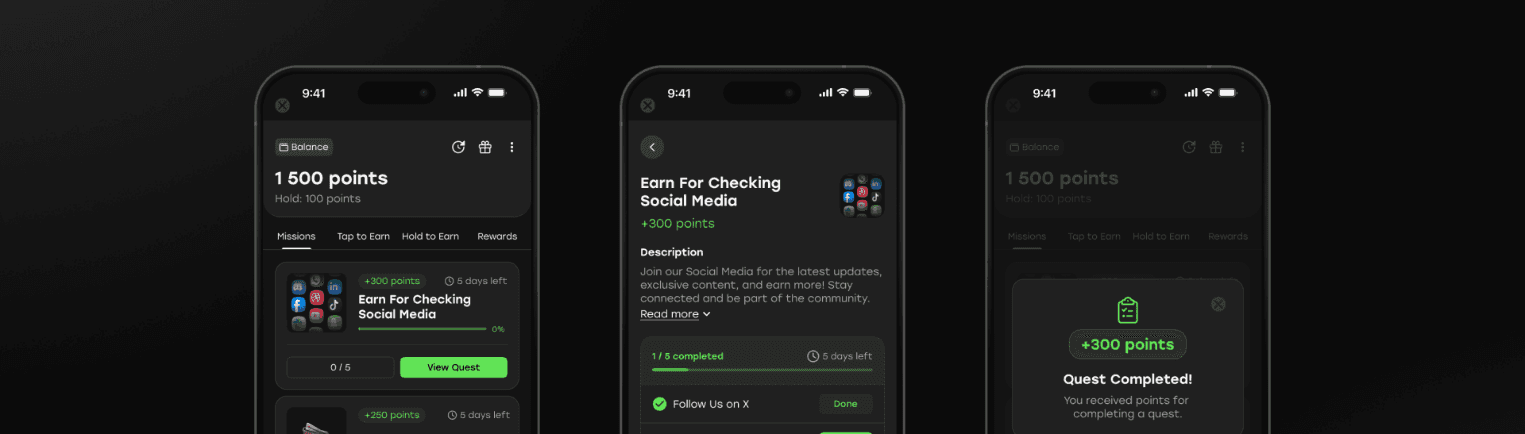
If you want to run 4x more experiments per quarter without adding engineering headcount 🡺 Enable3's Missions are exactly what you need. Your growth team designs and launches engagement experiments in minutes, not sprints. Configure the trigger event, the reward, the duration, and the eligibility criteria. Launch. Measure. Decide.
Problem #2: Your retention curve flatlines at Day 7
Users complete onboarding, use the app for a few days, and then disappear. Your D1 retention is reasonable. Your D7 is acceptable. But the curve drops off a cliff after that because there is no structured reason to return once the novelty wears off.
If you want to extend your retention curve beyond the initial activation period 🡺 Enable3's Streaks mechanics are exactly what you need. "Check in daily to earn loyalty points." "Maintain a 14-day streak to unlock a 2× reward multiplier." These mechanics leverage loss aversion – the psychological discomfort of breaking a streak – to give users a concrete, accumulating reason to open your app every day, even when they have no transactional need.

What’s more, Streaks are configurable without engineering. That means you can run a two-week experiment testing different kinds of Streaks – daily, weekly, or monthly – to see which one produces stronger D14 retention in a specific cohort – and have results before your next sprint review.
Problem #3: Your viral loop has a K-factor below 0.1
You have a referral program, but it generates a trickle rather than a loop. Users share occasionally. Conversion rates from shared links are low. The referred users who do arrive churn at the same rate as organic installs – which means the referral program is a cost, not a growth engine.
If you want your referral program to filter for quality rather than volume 🡺 Enable3's Referral Program supports conditional, tiered rewards that increase K-factor at every stage. "Invite 1 friend who completes KYC → 100 points." "Invite 5 friends who each make a $20 purchase → 500 points." The conditions ensure that referred users have demonstrated real intent before either party is rewarded.
With one of our clients, Enable3's referral program with referral gamification features generated 628 new users, of whom 34 converted to paid customers – a referral-to-paid conversion rate meaningfully higher than their paid acquisition channels. That quality difference is the direct result of conditional reward design.
Problem #4: You cannot run growth experiments on specific user segments
You want to test a win-back mission on dormant high-value users, an upgrade challenge on users approaching a tier threshold, and a feature-adoption quest on users who have not yet tried your newest feature. But your engagement system treats all users the same, so every campaign goes to everyone.
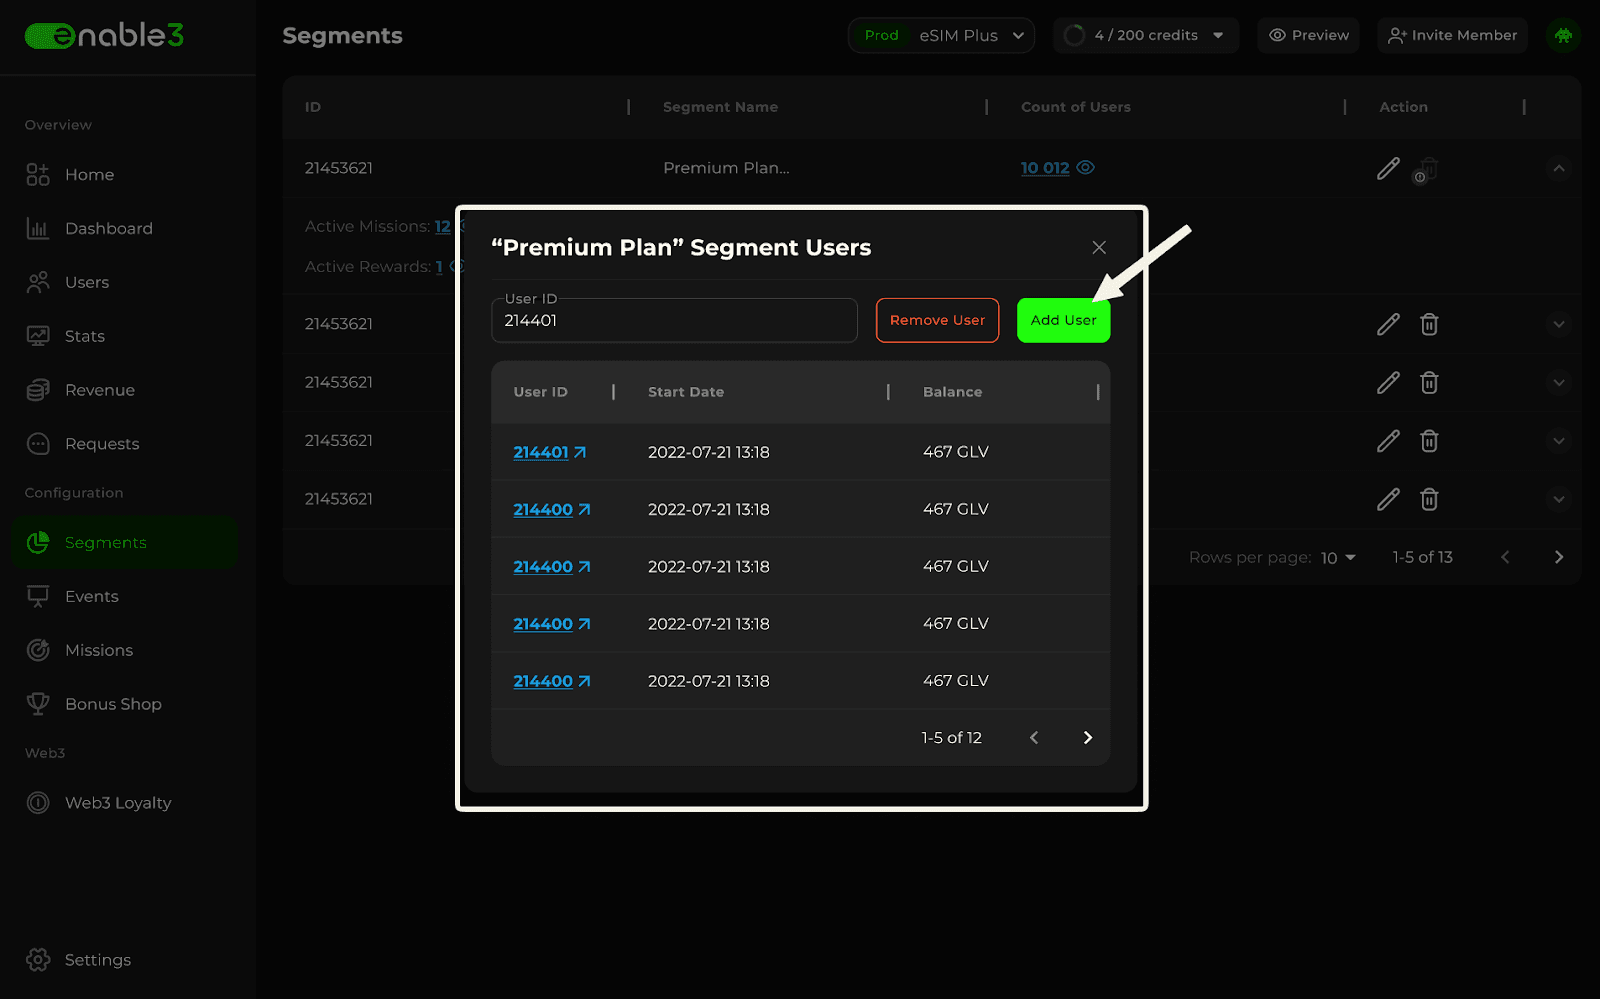
If you want the segmentation that separates effective growth teams from average ones 🡺 Enable3's Segments allow you to group users by mission completion history, purchase patterns, session recency, current loyalty tier, or engagement score. Build a segment, attach a mission to it, and launch – the right experiment to the right cohort, automatically. No manual list-building, no CSV exports.
Problem #5: You cannot connect your engagement experiments to revenue outcomes
You ran a streak challenge. Completion rate was 34%. But did it actually increase LTV? Did it reduce churn? Did the users who completed the streak spend more than those who did not? Without this data, you cannot prioritize the next experiment, and you cannot defend the investment to stakeholders.
If you want to draw a clean line from engagement mechanics to revenue outcomes 🡺 Enable3's analytics dashboard shows mission completion rates, reward redemption patterns, segment performance, and the downstream revenue correlation of each engagement mechanic. You can see which missions drive return sessions, which streaks correlate with higher ARPU, and which user segments respond to which incentives. That is the data to optimize your growth loop continuously – and the data to make the business case with confidence.
Problem #6: Your seasonal campaigns require engineering every time
January's "New Year Challenge." Valentine's Day engagement push. Back-to-school onboarding flow. Every seasonal campaign requires a spec, engineering resources, QA, and a release cycle. By the time it ships, the seasonal window is half over.
Enable3's Quests are multi-step engagement campaigns that can be configured, launched, and expired on a calendar schedule – no code, no release cycle, no engineering dependency. "Complete 5 workouts in January → earn 500 bonus points." "Refer 3 friends during our anniversary week → unlock a premium reward." The growth team builds, launches, and measures the campaign independently, at the speed the seasonal calendar demands.
Problem #7: You need to test whether status and progression drive long-term retention
Your engagement mechanics reward individual actions but create no ongoing status to protect. Users earn points, redeem them, and return to zero. You suspect that a tiered progression system would extend your retention curve – but building one is an engineering project, not an experiment, so it sits in the backlog rather than getting tested.
Enable3's Tiers let you configure a progressive membership structure – Bronze, Silver, Gold – and test its impact on retention without a development sprint. Each Tier unlocks better rewards, exclusive missions, and higher-value perks. Tier conditions can be set based on points accumulated, specific actions taken, or the Segment a user belongs to – so you can test different progression models against different cohorts and measure which drives the strongest D30 and D90 retention.

Users approaching a Tier threshold make decisions specifically to reach it – sessions they would not have opened, purchases they would not have made – and that threshold effect is measurable in your cohort data.
Problem #8: You need to know which reward types actually change users’ behavior
Your rewards catalogue exists, but you do not know which reward type drives the behavior change you want. Is it an instant digital benefit? A discount code? A physical prize that requires manual approval? You have a hypothesis, but no way to test it quickly enough to act on it.
Enable3's Rewards & Redeem gives you 3 reward types – Automatic, Promo code, and Manual – that you can configure and swap without engineering.
Automatic rewards fulfil instantly when a user requests them, ideal for testing whether immediacy drives repeat engagement. Manual rewards require an approval step, giving you control over high-value prizes while you validate whether premium reward tiers justify the fulfilment overhead.
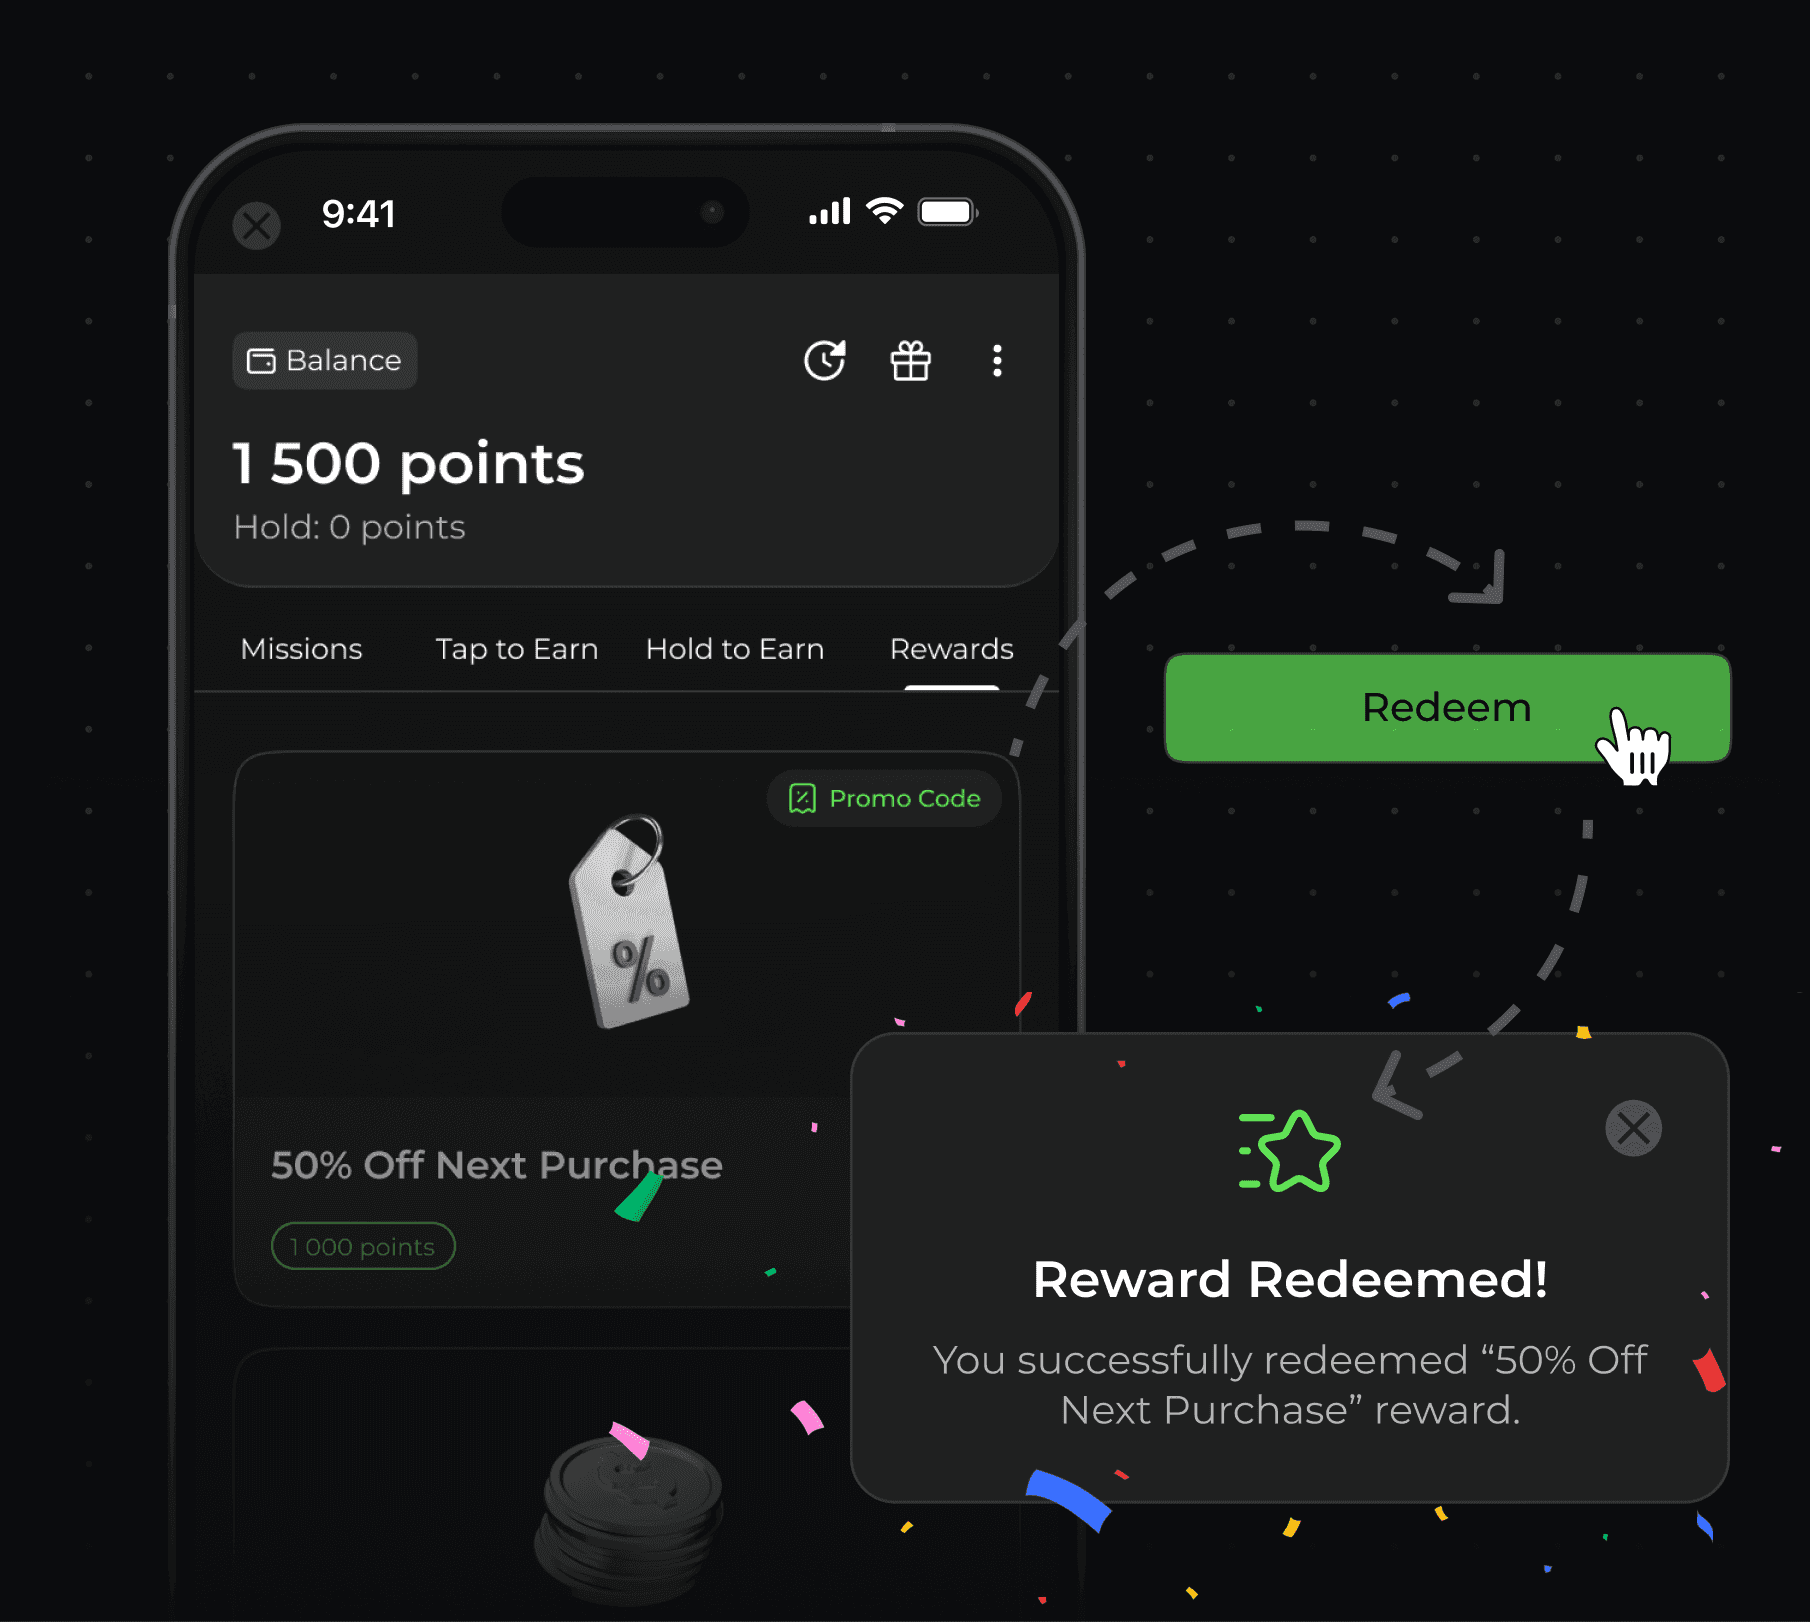
Run the same mission with a different reward type for each cohort and let the completion data tell you which model your users actually respond to.
Problem #9: You need to know which commitment mechanics work the best
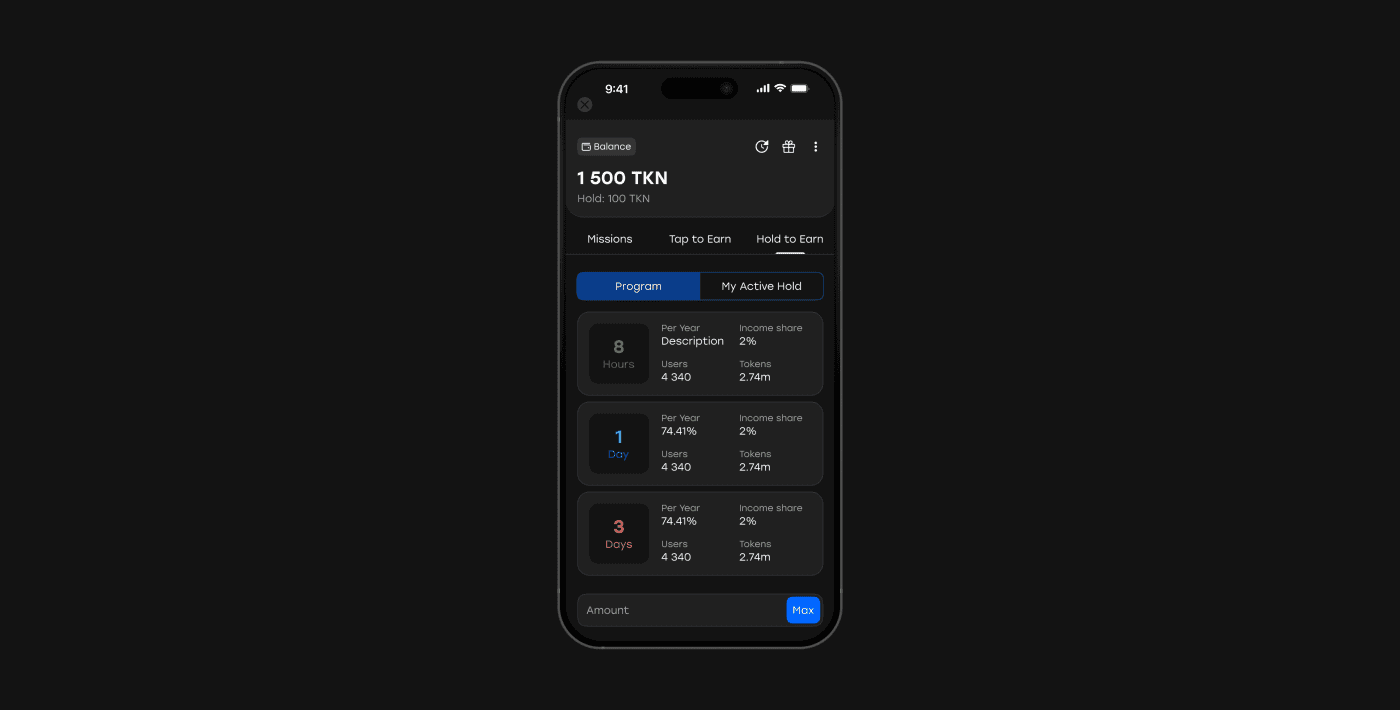
Users earn points and spend them immediately. You want to know whether a commitment-based mechanic – one that rewards users for holding their balance rather than spending it – would increase mobile app retention by creating a financial stake in staying active.
Enable3's Hold to Earn lets you configure a holding program without a development sprint. Users lock their points balance for a defined period and earn additional points in return – the longer they commit, the more they accumulate.
You can test this mechanic on a specific segment, measure whether mid-hold users return more frequently than a control group, and decide whether to scale it based on actual cohort data rather than assumption.
A user who is 3 weeks into a 30-day hold program has a concrete, time-bound reason not to churn – and that effect is directly attributable to your retention curves.
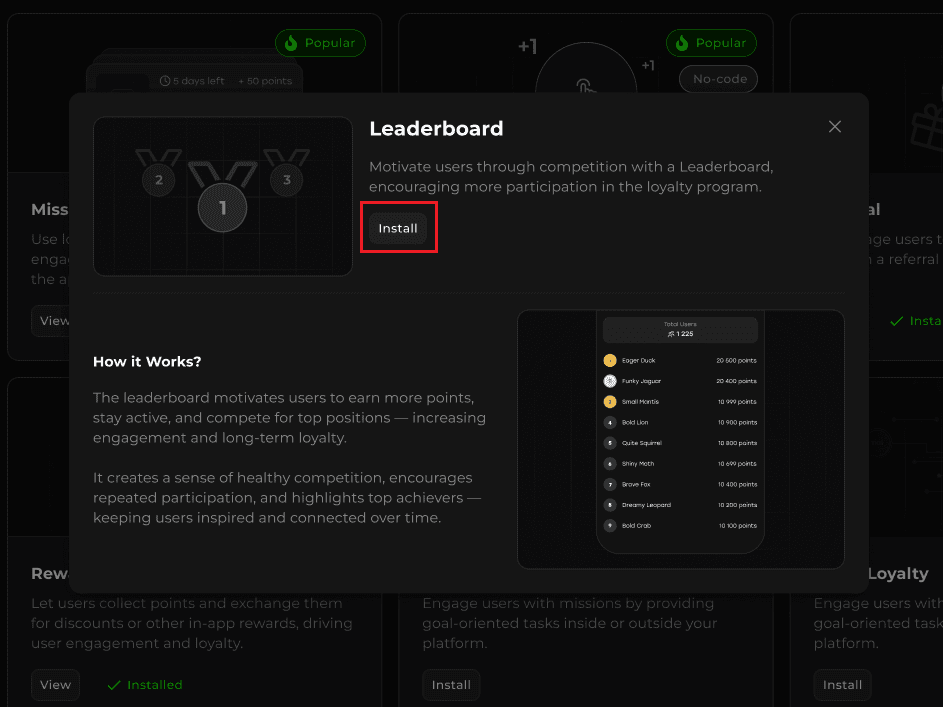
Problem #10: You need competitive engagement for your app
Some of your users are not motivated by rewards alone. They are motivated by rank, status, and the visibility of their standing relative to others. You have a hypothesis that a competitive mechanic would drive higher session frequency among this segment – but you have no way to test it without building something from scratch.
Enable3's Leaderboard lets you activate a competitive engagement layer and measure its impact on your retention and engagement metrics without an engineering sprint. Users see their rank among all participants by total points earned – updated every 10 minutes – and the Friends tab shows referrers how their referred users are performing, creating a social stake in bringing in active contacts rather than anyone.
Because rank is based on cumulative points earned rather than current balance, spending on rewards does not cost users their position – which means you can test whether competitive mechanics and redemption mechanics can coexist in the same loyalty program without one cannibalizing the other.
The compounding difference between apps that grow and apps that stall is not a budget. It is systems. Growth loops that reinforce themselves. Experiments that produce learnings faster than the competition. Engagement mechanics that create daily habits. Metrics that connect behavior to revenue. And the operational speed to ship all of it before the next cohort of users has churned.
That is the system this playbook has outlined. Enable3 is the platform that helps you build it – without waiting for engineering, without starting from scratch, and without breaking the product experience you have already worked to create.
Growth does not compound on its own. It compounds when you have the infrastructure to run the right experiment at the right moment, measure what actually moved, and scale it before the window closes. If you are ready to build that infrastructure – contact us and we will get you running.
FAQ
What is a mobile app growth strategy?
A mobile app growth strategy is a structured, data-driven system for increasing the long-term value of a mobile application through continuous experimentation across the post-install user journey. Unlike app marketing, which focuses on acquisition channels and driving installs, a growth strategy covers activation, engagement, retention, monetization, and referral. The best growth strategies operate as loops rather than funnels: the output of each stage feeds the input of the next, creating compounding effects over time.
How is app growth different from app marketing?
App marketing is focused on getting users to discover and install your app – through channels like ASO, paid UA, social media, and influencer partnerships. App growth is focused on what happens after the install: how quickly users activate, how often they return, how long they stay, how much they spend, and how many others they bring. Marketing is a cost center that scales linearly. Growth, when built as a system of loops and experiments, can scale exponentially. For a deep dive into the marketing side, see our App Marketing Strategy guide.
What is a good retention rate for mobile apps?
Retention benchmarks vary significantly by category. According to industry, typical Day-1 retention ranges from 25–40%, Day-7 from 12–20%, and Day-30 from 6–12%. Social and entertainment apps tend to have higher D1 but steeper curves. Utility and finance apps tend to have lower D1 but flatter curves. The most meaningful benchmark is not an industry average – it is your own app’s retention curve improving cohort over cohort as you run experiments and optimize the post-install experience.
How to grow an app efficiently?
App growth comes down to one sequence: fix retention before you scale acquisition, then build the loops that make retention compound. If your Day 30 retention is below 10%, increasing your install volume accelerates losses rather than growth – every new user churns at the same rate, and the unit economics deteriorate.
The lever that changes this is what happens between installs:
onboarding that reaches the “aha” moment in the first session
habit mechanics that give users a reason to return independently of a transaction
progression systems that raise the cost of leaving, and
a referral program that rewards activation rather than signup.
Once those mechanics are in place and producing improving cohort retention, paid acquisition spend compounds rather than leaks – each dollar acquires a user into a system designed to keep them, which is what separates sustainable app growth from expensive churn replacement.
How to optimize mobile app onboarding?
Effective app onboarding optimization has one job: get the user to the “aha” moment – the point where they genuinely feel the value of the product – before they have a reason to leave. The most common mistake is treating the first session as a product tour, which delays value and increases drop-off at every step.
The design principle that consistently works is the reverse: lead with the core value, defer registration and preference collection until after the user has experienced something worth returning for, and attach a reward to the two or three actions that most reliably predict long-term retention. Measure what percentage of new users reach your defined activation event in their first session – if it is below 50%, work backward through every step between install and that event and remove anything that is not strictly necessary to deliver value.
How to reduce mobile app churn rate?
Churn is almost never caused by a single failure – it is the result of a gap between what the product promised and what the user experienced over time, compounded by the absence of a structured reason to return.
The app churn reduction interventions that move churn metrics most reliably operate across 3 time horizons:
early churn (Day 0–14) is addressed by onboarding improvements and a day-two hook that creates an in-product obligation to return;
mid-term churn (Day 15–90) responds to progression mechanics – tier systems, streak challenges, and feature-adoption campaigns – that give users ongoing motivation beyond the initial novelty; and
long-term churn is reduced by accumulation mechanics that raise the perceived cost of leaving, whether that is a points balance approaching a redemption threshold, a tier status worth protecting, or a streak that took weeks to build.